Hi @brianwclayton1969,
I hope you are well. 
Thank you for the Model, it made it a lot easier to assess everything. My findings are shown below:
The revised Loads Report along with Space Schedule and new Btu/h values can be depicted from the images. (I'll explain how I got to it further down).
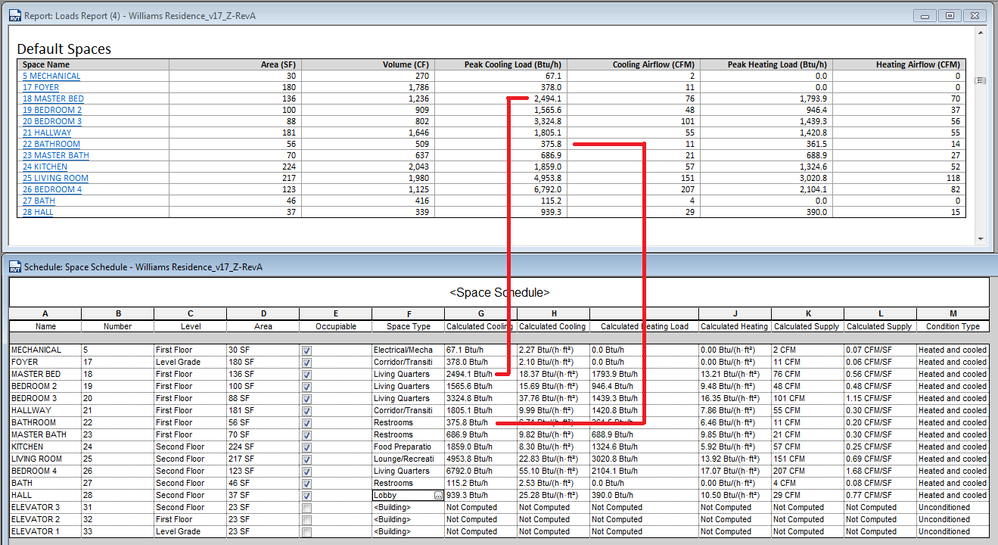
Below is a comparison between two load reports, one using Building Elements and Function Parameters (Space Type) and the other one using Building Envelope Exterior Elements. I generally use the Function Parameters, but you'll notice that there isn't a major difference in all spaces between the two reports in this scenario.

Occupancy Schedules along with Space Type (Lighting and Power Schedules) are also important. Let's have a look at the Master Bath below. Space Type >> "Restrooms" >> Occupancy, Lighting and Power Schedules >> "Residential Lighting - All Day" (This can be changed to your liking with some of the other predefined Schedules). I used the same occupancy, Lighting and Power Schedules for each of the Space Types in you Project.

Lastly, one of the main culprits was you Space Limit Offset. The Master Bath provided you with desire Btu/h readings, but as you mentioned, the Master Bed just below the highlighted space and Bathroom to the left of the highlighted space gave Btu/h readings which were very high. I simply assigned the same Limit Offset to all of the Spaces on the First Floor. Then I took the Limit Offset assigned to the Living Room on the Second Floor and assigned the same Offset to the rest of the Spaces on the Second Floor.

I hope this helps!
Rudi Roux
MSc | Digital Engineering Manager
LinkedIn
Revit Mechanical & Electrical Systems 2018 Certified Professional | Revit MEP & Architecture 2015 Certified Professional
AutoCAD 2015 Certified Professional | Autodesk Building Performance Analysis (BPA) Certificate
If this post resolved your issue, kindly Accept as the Solution below. Kudos are always welcome ⇘







 Spaces go through masses. Never-mind the times which we received a new arch model just to find that some of their ceilings have been deleted
  (Obviously providing problematic reporting).


