Hello, Fabio
There are no build in features, or apps that i know of, but let me see if i can walk through the concept of this.
Simple Method:
1. Export data from a schedule, or use something like case tools to export data in separate tabs, its really your preference
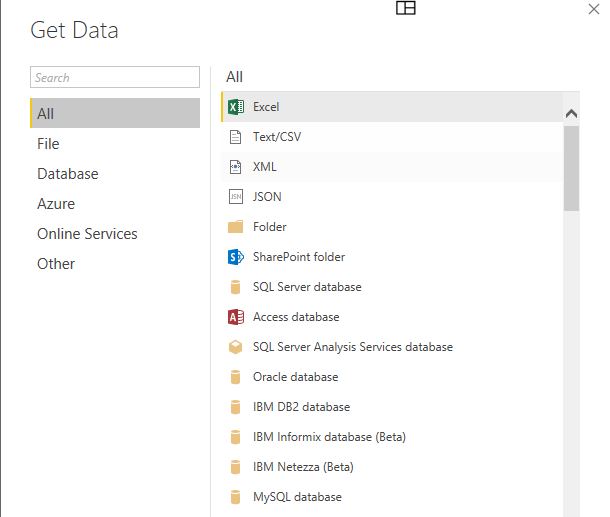
2. Import data in to Power BI
3. Create a data model or simply just begin visualizing the data automatically.
Advanced Method:
1. You will need to have a database to store the data you export from the revit model.
1. SQL server express is the cheapest, and can be configured on your local machine (i would advise to put it on a VM) (this will be created automatically if you use clarity
2. SQL Server
3. MS SQL Server
4. Other? (havent tried)
2. You will need to have some sort of database export tool
1. Clarity is by far probably the most user friendly
2. Revit DB Link is sort of the Autodesk Stock export tool
3. (If using DB link) You will need create some connection string between your revit model and the target database
4. In powerbi, create a connection to your database using whatever protocols your database will allow.
5. Select the data tables you wish to see, and define the relationships to visualize your data
6. Assemble your dashboards with whatever reports/data you want!
Every time you export the data from the advanced method, you can refresh your dashboard, and all of your data will be up to date, and you wont have to rebuild your visuals (unless you defined your relationships poorly)
If Jeremy sponsors me, i would be happy to do a presentation at AU next year 🙂
best of luck


