Community
- Forums Home
- >
- Inventor Nastran Community
- >
- Inventor Nastran Forum
- >
- Warning: Dangerous in Inventor Nastran's Solid Analysis with liner elements
Inventor Nastran Forum
Welcome to Autodesk’sInventor Nastran Forums. Share your knowledge, ask questions, and explore popular Inventor Nastran topics.
Turn on suggestions
Auto-suggest helps you quickly narrow down your search results by suggesting possible matches as you type.
Warning: Dangerous in Inventor Nastran's Solid Analysis with liner elements
15 REPLIES 15
Reply
Topic Options
- Subscribe to RSS Feed
- Mark Topic as New
- Mark Topic as Read
- Float this Topic for Current User
- Bookmark
- Subscribe
- Printer Friendly Page
Message 1 of 16
07-02-2024
01:45 PM
- Mark as New
- Bookmark
- Subscribe
- Mute
- Subscribe to RSS Feed
- Permalink
- Report
07-02-2024
01:45 PM
Warning: Dangerous in Inventor Nastran's Solid Analysis with liner elements
Hi all,
I am writing this post to warn you about Inventor Nastran's linear elements for solids.
I will give you a simple example.
For a 3x100mm x1000mm long flat plate, both ends fixed, made of aluminium, and under a load 1kPa. By manual calculation, the max stress in the plate is [1.0kPa*0.1m*(1000mm)^2/12] / [100*3^2/6]=55.56MPa and the deflection is 1.0kPa*0.1m*(1000mm)^4/(384*70000*100*3^3/12)=16.53mm.
Inventor Nastran , linear mesh 5mm, data conversion maximum, deflection 3.5mm, stress 25MPa.


Inventor Nastran , linear mesh 0.5mm, 1.5h meshing + running clacs, data conversion maximum, deflection 15.5mm, stress 71.5MPa. (It is grey colour due to the extremally fine mesh).


So, as you can see, even a fine mesh does not give correct results.
15 REPLIES 15
Message 2 of 16
07-03-2024
01:32 AM
- Mark as New
- Bookmark
- Subscribe
- Mute
- Subscribe to RSS Feed
- Permalink
- Report
07-03-2024
01:32 AM
Hi, the problem is that you are using linear Tetraeders. These are the most dangerous elements for stress analysis and should never be used, because they are too stiff. Nastran itself is not the problem.
I have attached your example (with symmetry) with different kind of elements and their densitiy (6mm and 1mmm) in Inventor Nastran and Ansys with the same boundary conditions - the results are nearly the same. Maybe the Inventor Stress Analysis is using second order elements by default.
Message 3 of 16
07-03-2024
01:59 AM
- Mark as New
- Bookmark
- Subscribe
- Mute
- Subscribe to RSS Feed
- Permalink
- Report
07-03-2024
01:59 AM
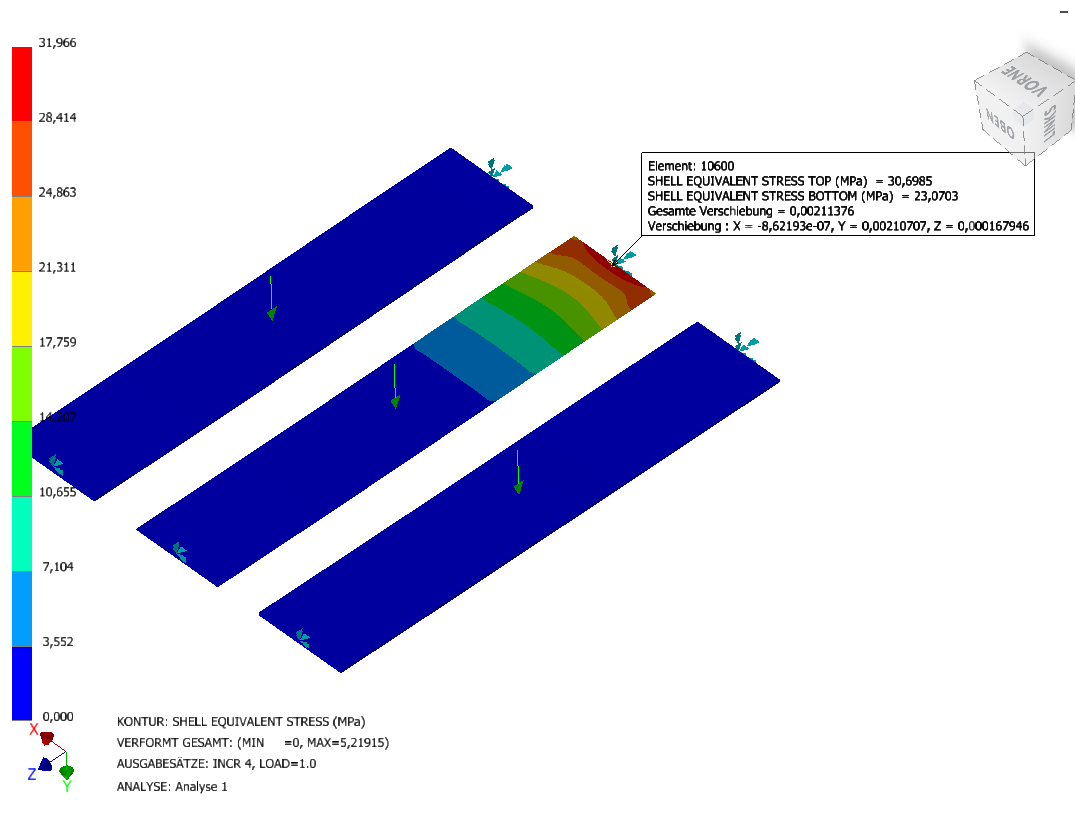
Furthermore interesting is, that you maybe have to include nonlinear effects with large rotations in your analysis after correction of the mesh. The displacements / stresses in linear and nonlinear static analysis differs from each other (you get also in Ansys the same results). Here you see the comparison of 2nd order Tetraeders, 2nd order Shells and 1st order Tetraeders with an size of 6mm
Message 4 of 16
07-03-2024
02:11 AM
- Mark as New
- Bookmark
- Subscribe
- Mute
- Subscribe to RSS Feed
- Permalink
- Report
07-03-2024
02:11 AM
And where is it stated that I shouldn't use linear tetrahedrons? Some guides I saw referred to linear elements to speed up the calculations. Nonlinear analysis with parabolic elements that I was using before was giving me similar results. Here is the outcome:

This is not even close to the true results, so only linear analysis with parabolic elements is correct.
Message 5 of 16
07-03-2024
02:40 AM
- Mark as New
- Bookmark
- Subscribe
- Mute
- Subscribe to RSS Feed
- Permalink
- Report
07-03-2024
02:40 AM
Sorry, that you don´t should use linear elements is basic knowledge for FEM Analysis in my opinion. This is the first thing what you have to learn for practical use.
The difference between linear and nonlinear Analysis is the stress stiffening effect. Your beam is like a guitar string - it´s going to be stiffer and stiffer with more load. You can see it in the force reactions of the boundary conditions. In linear analysis there is no force in z-direction - but in an nonlinear analysis, because of other theory for calculating the element stiffness matrices. This is the reason why you have less deflection and less stress in an nonlinear analysis with parabolic elements in contrast to a linear analysis. The attached z-force is plotted from an nonlinear analysis in Ansys over the substeps until you reach 0,001 MPa at t=1s, because its more easier to get this graph than in Nastran.
Message 6 of 16
07-03-2024
02:57 AM
- Mark as New
- Bookmark
- Subscribe
- Mute
- Subscribe to RSS Feed
- Permalink
- Report
07-03-2024
02:57 AM
But there is maybe a bug in Nastran, when you want to plot a XY-curve in a nonlinear static analyis. The load scale factor is not correctly used for the diagram and the curve make no sense in this way. If you use the standard diagram "Maximum Displacement Versus Load Scale Factor" in the browser, then it is correctly. Maybe @John_Holtz has an answer?
Message 7 of 16
07-03-2024
03:21 AM
- Mark as New
- Bookmark
- Subscribe
- Mute
- Subscribe to RSS Feed
- Permalink
- Report
07-03-2024
03:21 AM
My findings were that when using large assemblies with a fine mesh set by the mesh setting tool, i.e.

Linear static assessment with parabolic elements showed dangerously underestimated results, both in stress and deflection. In contrast, Inventor Professional, with a much larger mesh, provided much higher results. As a result element size should be set to, for example, a maximum of 0.001 of the element size. Otherwise, it is dangerous to use.
Message 8 of 16
07-03-2024
04:28 AM
- Mark as New
- Bookmark
- Subscribe
- Mute
- Subscribe to RSS Feed
- Permalink
- Report
07-03-2024
04:28 AM
I suggest to read in detail and try out
https://help.autodesk.com/view/NINCAD/2024/ENU/?guid=GUID-156AC319-E5D7-4ED5-9765-4B58D72323D0
Another point are follower forces in nonlinear calculations next to stress stiffening.
It wouldn´t be effective to restrict mesh settings. It always depends on the problem and what you are looking for. It´s better to get a deep understanding of FEA and know the possibilties and risks.
Message 9 of 16
07-03-2024
04:51 AM
- Mark as New
- Bookmark
- Subscribe
- Mute
- Subscribe to RSS Feed
- Permalink
- Report
07-03-2024
04:51 AM
For the thin elements I design, a large deflection is always the case, usually L/90 or more. So, are you saying I shouldn't be using nonlinear analysis? As mentioned before, nonlinear analysis with parabolic elements gives me wrong results (see example in message 4) unless I have a very small mesh. Usually, I use 3mm and 0.2mm mesh refining around the holes, but this takes a lot of time to process. In contrast, Inventor Professional gives me good results with a larger mesh and in a quarter of the time.
Message 10 of 16
07-03-2024
10:13 PM
- Mark as New
- Bookmark
- Subscribe
- Mute
- Subscribe to RSS Feed
- Permalink
- Report
07-03-2024
10:13 PM
I didn´t say you shouldn´t use nonlinear analysis. I have tried to describe the reasons, which could be important to understand, why the results in a nonlinear analysis are different from a linear analysis.
I think you are leaving the acceptable conditions with those thin structures with regard to a linear theory (mutually you have also the "wrong" basis with your analytical solution). Would you choose a stiffer cross section with more height, your results must become closer between a linear and nonlinear analysis (with the same element type and mesh density).
Parabolic Tetraeder elements should be prefered over their linear variant. The displacement field in a linear Tetraeder is linear an in a parabolic one from a dimension of second order. The stress and strains behave like the first derivative of the displacement field - So in a linear tetraeder you have a constant stress field and in a parabolic one a smoother linear stress field.
Try to make simple plate with a hole under tension and do a mesh convergence study with these element types and look after the notch stresses in the hole for your own experience.
Message 11 of 16
07-03-2024
11:53 PM
- Mark as New
- Bookmark
- Subscribe
- Mute
- Subscribe to RSS Feed
- Permalink
- Report
07-03-2024
11:53 PM
Okay, thanks for your help. It seems I listened to two idiots who said in their YouTube guide that linear mesh could be used to speed up calculations and avoid some errors. Obviously, for large thin elements, using nonlinear analysis will give me much smaller deflection, so my designs seem to be okay. Luckily, I didn't use linear elements for long and noticed something was wrong with it, hence the post.
Message 12 of 16
07-04-2024
11:54 PM
- Mark as New
- Bookmark
- Subscribe
- Mute
- Subscribe to RSS Feed
- Permalink
- Report
07-04-2024
11:54 PM
Maybe it could be important for such thin elements, that you have to model more precicly the clamping of the ends and the stiffness of the surrounding structure - because of the very small bending stiffness itself and big length. If you are interested in a more realstic deflection. The fixed support of all 6DOF at the ends with boundary conditions is maybe too rigid.
Message 13 of 16
07-08-2024
01:44 PM
- Mark as New
- Bookmark
- Subscribe
- Mute
- Subscribe to RSS Feed
- Permalink
- Report
07-08-2024
01:44 PM
Hi @markus_schulten and @p_pietrusewiczSE5ZD
Markus is correct that the graph shown in Nastran_curve2.png is due to a software issue. When the decimal symbol is a comma (,) the load scale factor numbers get truncated. The load 0,0001 through 0,9999 are interpreted as 0 which puts the points on the Y axis. Then the load of 1,0 is interpreted properly as 1.0 and the point is at the correct location on the graph. (Or almost the correct location. I'm sure the stress value is also truncated from 16.xxxx MPa to 16 MPa.) See Incorrect graph of XY Plot result in Inventor Nastran for more details.

Otherwise, I agree with the rest of the conversation:
- Thin structures should not be modeled using solid. Solids cannot accurate calculate the change in stress from full tension one side to full compression on the other side with only 1 element through the thickness. (Although in some cases the results can be relatively accurate. See Thin parts can have inaccurate results when using solid elements which only discusses the displacements.)
- Thin structures should be modeled using shells. If solid have to be used, use a parabolic mesh. (Linear mesh is good for testing the model to make sure everything is setup properly since the runtime is faster. But a faster runtime does not mean accurate results!)
- A linear analysis is based on small displacement theory. The analysis does not care if the 1 m long cantilever beam bends down 10 m. The displacement is the same as the hand calculation, meaning both the hand calculations and linear stress analysis are wrong because they exceed the limitation of small displacement theory.
- A nonlinear analysis updates the stiffness and geometry as the load increases. The 1 m long cantilever beam can only bend down 1 m (plus any small change in length due to the tensile load). See When to use nonlinear simulation instead of a linear simulation for details.
John
John Holtz, P.E.
Global Product Support
Autodesk, Inc.
If not provided already, be sure to indicate the version of Inventor Nastran you are using!
"The knowledge you seek is at knowledge.autodesk.com" - Confucius 😉
Message 14 of 16
07-10-2024
10:49 PM
- Mark as New
- Bookmark
- Subscribe
- Mute
- Subscribe to RSS Feed
- Permalink
- Report
07-10-2024
10:49 PM
Dear @John_Holtz ,
thank you for the explanation with the graph, but the solution is not satisfying. The problem is, that there are numerous of sofware products, which are working in parallel in a company. Our IT-admin is rejecting the general usage of "." for the decimal symbol, because of possible conflicts with other software (in Europe the "," is the general case). Two or three years ago Ansys Mechanical had the same problem with their probes and they solved it within one release.
I have seen, that the Nastran editor itself is showing the graphs correctly. So I think it has something to do with the interpretation to the Nastran data with the user interface of Inventor. Do you think Autodesk will solve this long term issue?
Kindly regards
Markus
Message 15 of 16
07-11-2024
09:16 AM
- Mark as New
- Bookmark
- Subscribe
- Mute
- Subscribe to RSS Feed
- Permalink
- Report
07-11-2024
09:16 AM
The XY Plot has been fixed in version 2025.1 (which was released recently).
John
John Holtz, P.E.
Global Product Support
Autodesk, Inc.
If not provided already, be sure to indicate the version of Inventor Nastran you are using!
"The knowledge you seek is at knowledge.autodesk.com" - Confucius 😉
Message 16 of 16
07-15-2024
06:22 AM
- Mark as New
- Bookmark
- Subscribe
- Mute
- Subscribe to RSS Feed
- Permalink
- Report
07-15-2024
06:22 AM
Hi @John_Holtz ,
is it also possible to get an updated Inventor Nastran 2024.3 --> Inventor Nastran 2024.4 with this kind of hotfix?
Kindly regards
Markus
Reply
Topic Options
- Subscribe to RSS Feed
- Mark Topic as New
- Mark Topic as Read
- Float this Topic for Current User
- Bookmark
- Subscribe
- Printer Friendly Page
Forums Links
Can't find what you're looking for? Ask the community or share your knowledge.
Post to forums

