cancel
Showing results for 
Show  only  | Search instead for 
Did you mean: 

Graph/Analytics for inventory levels history

Graph/Analytics for inventory levels history

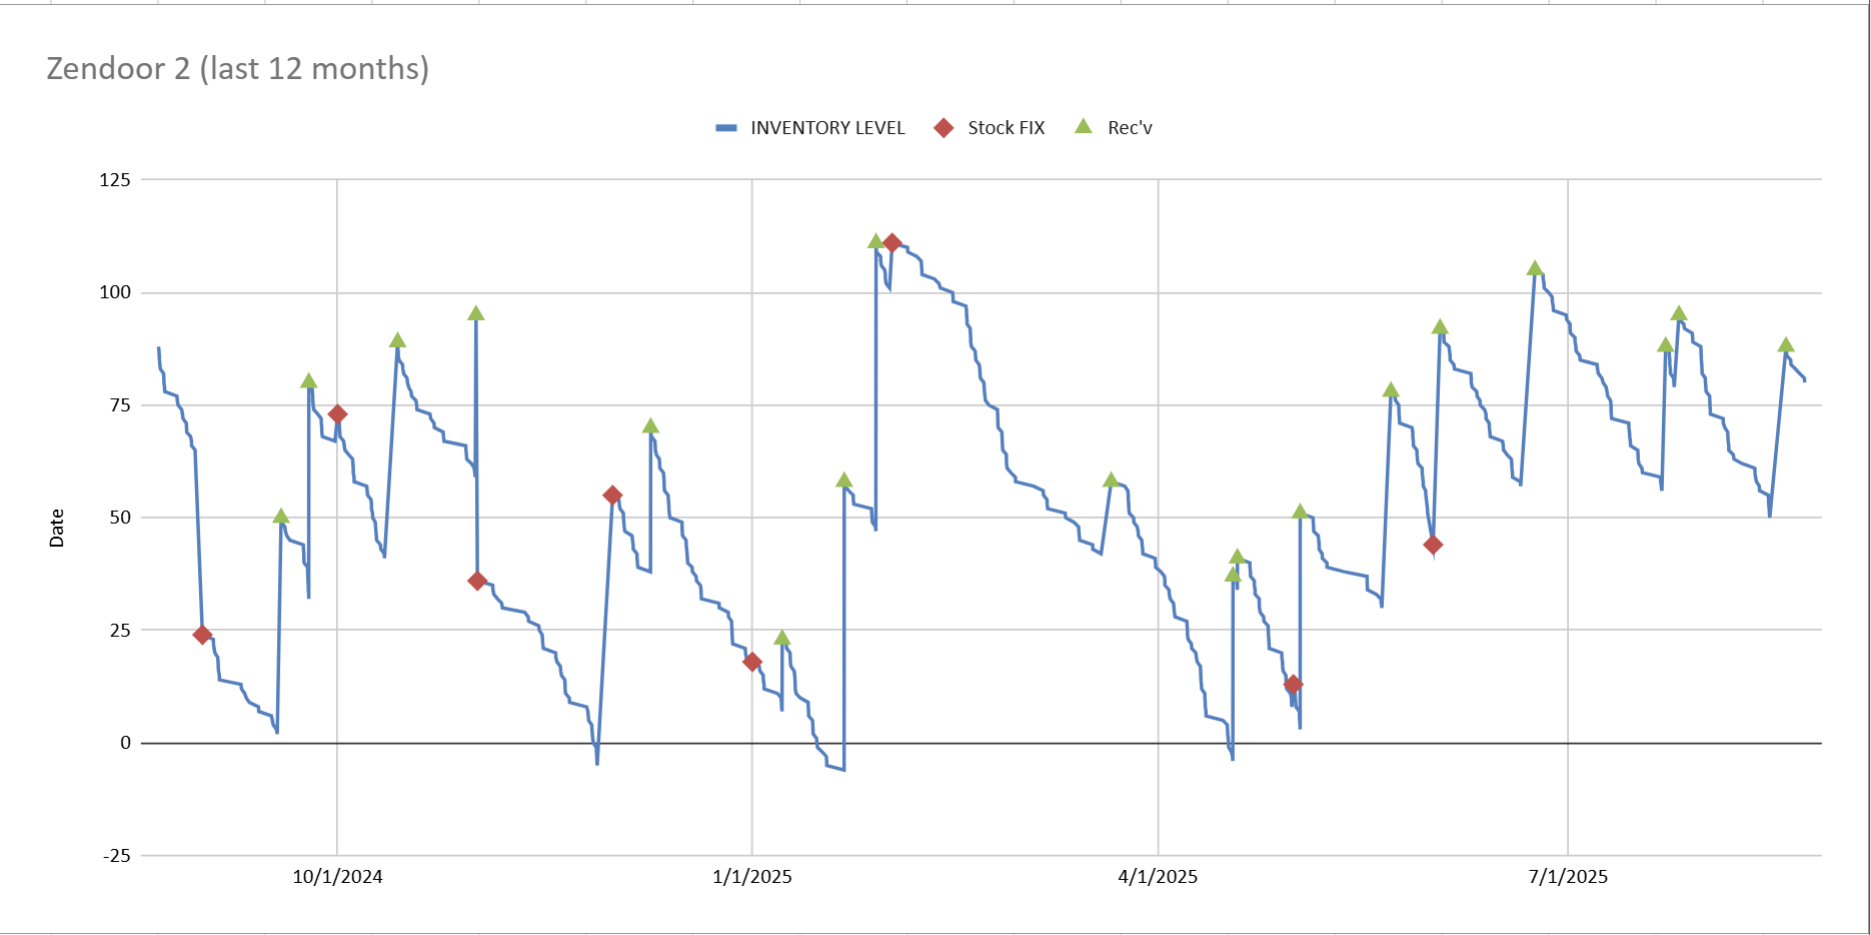
I would like to be able to view a graph of inventory levels for a given Product in Fusion Operations. I had to do it manually by exporting the Inventory Movements for the product, getting the current inventory level, and working backwards. Then I created a graph using Google Sheets. I'm very happy with the result but I'm not happy with all of the work I had to do manually to get this information. I also believe this would help solve some other threads on the idea board about low stock alerts, etc. I've also noted Stock Fix and Receiving as special events on the graph. 

1 Comment
andrade_david
Autodesk
Status changed to: Gathering Support

Thank you for sharing this idea, @adamL79LL 

You may also leverage Power BI to retrieve and process this data (see article with instructions), leveraging the inventory movements (documentation) and inventory (documentation) endpoints, but I appreciate the idea to have this data directly in Fusion Operations.

Can't find what you're looking for? Ask the community or share your knowledge.

Submit Idea