Is there a dashboard that shows the maximum time my buffer is taking?

Is there a dashboard that shows the maximum time my buffer is taking?

matheus_s2
Not applicable
72 Views
4 Replies
Message 1 of 5

Is there a dashboard that shows the maximum time my buffer is taking?

matheus_s2
Not applicable

[ FlexSim 20.1.3 ]

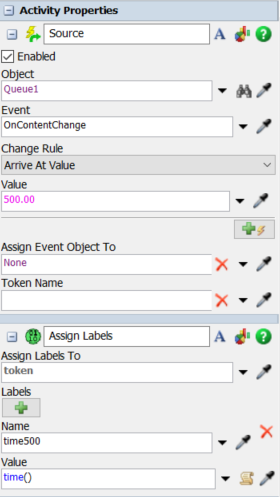
I have a queue of products, and I control that queue via trigger, opening the entry if the current quantity is less than 100 items, and closing when it reaches 500. So the line produces 400 items without the need to feed the buffer. I would like to see how long it is taking to consume the buffer. Taking into account that my process does not use a fixed time.

0 Likes
Accepted solutions (1)
73 Views
4 Replies
Replies (4)
Message 2 of 5

joerg_vogel_HsH
Mentor
Mentor

I would try Content vs. Time plot graph. If you need conditional durations then you evaluate the data in calculated table or externally.

0 Likes
Message 3 of 5

luis_gustavo_fsds
Not applicable
Accepted solution

As @Jörg Vogel said, you can use a Content vs. Time plot for a graphical visualization of the buffer content. For more accurate tracking you can use the process flow to get these trigger times assigning labels (by using the function "time()", it return the exact time of the event). With that label getting that content 500 time, you can use another label to get the content 100 time and subtract them, as you can see in the image bellow:

38909-1619662186804.png38910-1619662230916.png

After this you can set that token label into any resource on 3D model and pin that label statistc on dashboard or write that time into a global tabel

38921-1619662594744.png

38913-1619662782621.png

38888-1619662845278.png

38889-1619662874890.png

I'm leaving the model below, this is a way to do this, let me know if it helped and fulfill your doubt.

BufferConsumeTime.fsm

0 Likes
Message 4 of 5

joerg_vogel_HsH
Mentor
Mentor

If you need two significant levels reported versus time, I suggest to split your one queue into two queues. They work in a row and the sum of their capacity is the total capacity of your single queue now. The second queue gets a capacity of the low level of reporting e.g. 100. The first gets the difference to the total capacity e.g. 400. The first queue collects only items, if the second reaches the maximum capacity level of 100.

Message 5 of 5

matheus_s2
Not applicable

Thanks Luis Gustavo. It is exactly what I need.

0 Likes