Experimentation Report builder problem with dashboard html display

Experimentation Report builder problem with dashboard html display

sean_goh
Not applicable
3,569 Views
10 Replies
Message 1 of 11

Experimentation Report builder problem with dashboard html display

sean_goh
Not applicable

[ FlexSim 17.0.3 ]

I tried to use the Experimentation Report builder to customize the Performance measure/dashboard Report display that I want but after saving it and reopening with a few Web browser (IE, Firefox, Chrome, etc), many of the display cannot be shown.

Can you please advise on this problem ? Thank you...

This will be an important feature for us to generate a user friendly & intuitive report to send for review with project manager. Refer to attached sample Report builder file (Report buider.html) and the customized Report file (Report display.html) in the report-builder-issue.7z folder.

@[email protected]

0 Likes
Accepted solutions (1)
3,570 Views
10 Replies
Replies (10)
Message 2 of 11

philboboADSK
Autodesk
Autodesk

You need to post the model that generated these reports to know why those charts aren't displaying correctly.

It looks like you don't have any Scenarios.


Phil BoBo
Sr. Manager, Software Development
0 Likes
Message 3 of 11

sean_goh
Not applicable

Have created a sample test model to experiment with this issue. It seems that only the Raw data & Summary data charts are not displayed. Refer to attached "test6.fsm" model (with two scenarios Layout 1 and 2) and Report files. Thanks...

0 Likes
Message 4 of 11

jeff_nordgren
Not applicable
0 Likes
Message 5 of 11

philboboADSK
Autodesk
Autodesk
Accepted solution

The model you posted doesn't have the same performance measures as the output report that you posted.

Your report's dashboards:

6165-1.png

Your model's dashboards:

6166-2.png

When you create a Report Builder from the model you posted, it works perfectly fine and doesn't match the report builder you posted:

6167-3.png


Phil BoBo
Sr. Manager, Software Development
Message 6 of 11

logan_gold
Community Manager
Community Manager

When I opened the "test6 Experiment Report display.html" file, I see there are Raw Data and Data Summary sections that are being displayed:

6170-experimenterresults.png

Are you seeing something different? If so, will you post a screenshot of what you are seeing? I was able to get similar results with the "test6 Experiment Report builder.html" file, as well as creating files from the test6 model you posted.

0 Likes
Message 7 of 11

sean_goh
Not applicable
@Logan Gold

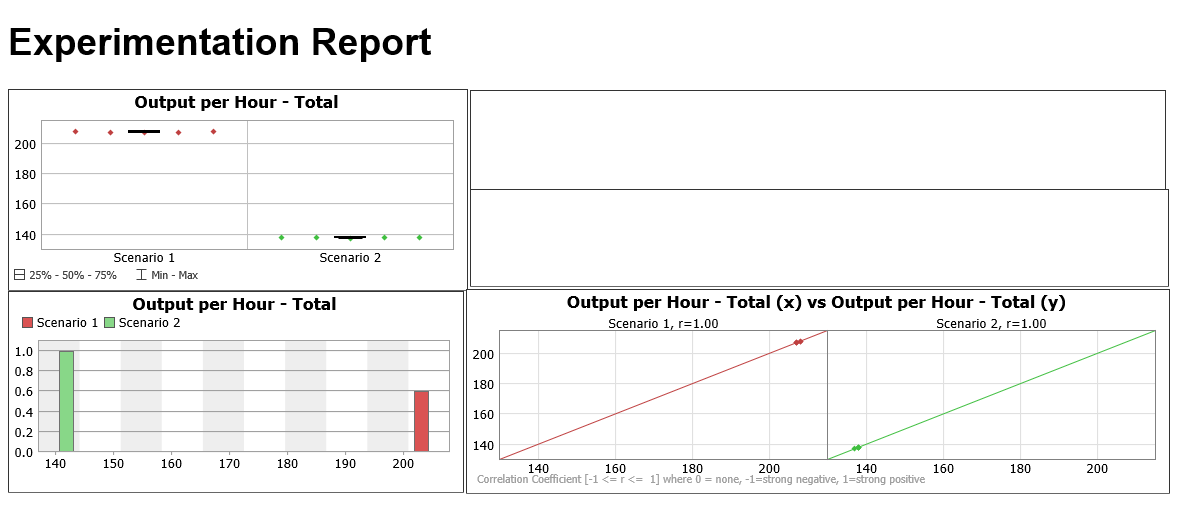
Thanks for the feedback. May I know what web browser app you are using? I have tried with different web browser and it seems only Internet Explorer (am currently using IE11) has the problem with displaying Raw data & summary data sections. Refer to attached screenshot of what I am seeing.

ie-display-rawsummary-data-not-shown.png

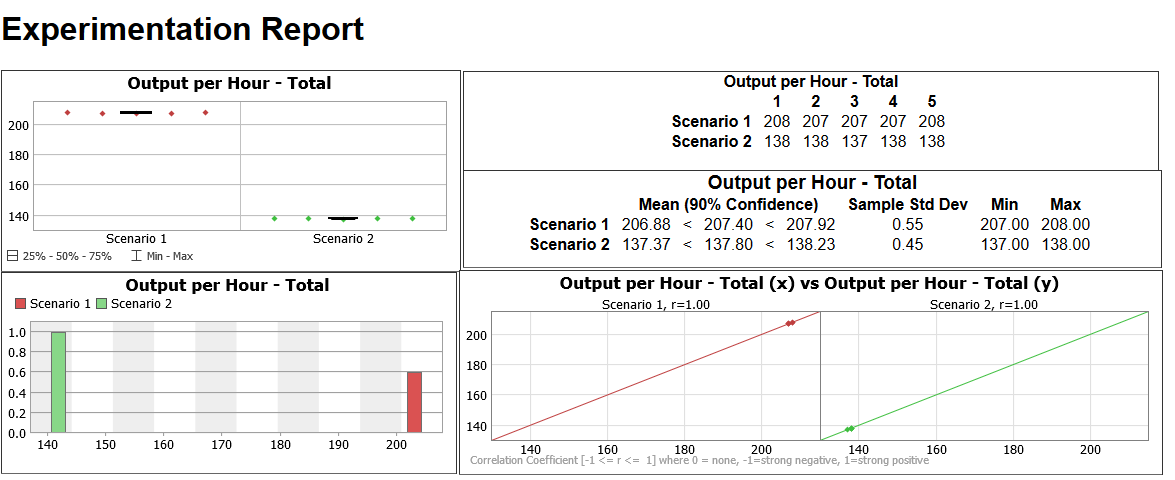
I tried with other web browsers (eg. Chrome, Firefox) and they are working fine with no issue. Refer to below screenshot of this good display.

chrome-firefox-display-rawsummary-data-shown.png

So it seems to be an issue with IE browser instead. Will try to figure out this.

0 Likes
Message 8 of 11

sean_goh
Not applicable

@phil.bobo

Thanks for the comments. I am sorry that I didn't post the actual project model for the initial first Report builder file I posted here to avoid any project confidentiality issue here. So I created and posted an experimental sample model & report builder to illustrate this issue.

It seems like the display are working fine after I enabled the control permissions on the "C:\ProgramData\Flexsim\FlexSim17.0\help" directory. The only issue is when opening the html report using Internet Explorer browser where the Raw & Summary data are not displayed (refer to earlier reply to Logan Gold above on this issue).

All the displays are working fine with other types of Web browsers so I think it is an IE issue. Thank you!

0 Likes
Message 9 of 11

logan_gold
Community Manager
Community Manager

I believe the HTML files are using JavaScript for some of their functionality, so it's possible that your installation of IE is prohibiting this JavaScript from functioning correctly. If you can find any settings in IE to enable JavaScript, that might fix your issues.

0 Likes
Message 10 of 11

philboboADSK
Autodesk
Autodesk

I added a note to the dev list to look into why that chart isn't displaying correctly in IE11. For now, you can use a different browser.

Thanks.


Phil BoBo
Sr. Manager, Software Development
0 Likes
Message 11 of 11

matt_long
Not applicable

@Sean Goh

If charts aren't displaying in IE, you just need to change your IE settings. To allow a single page to be loaded, you should see a alert box at the bottom of the screen when you first open the page.

6488-allowcontent.png

Clicking the Allow blocked content button will let that webpage load.

If you want to change this setting so IE always allows these files to be loaded, you can go to the Settings menu in the upper right corner and select Internet Options. Go to the Advanced tab and scroll down until you find the Security section. Check the box that says Allow active content to run in files on My Computer.

6489-allowcontentoption.png

Click Ok or Apply and then close and reopen IE and the page should work (you may need to restart your computer).