Automating Charts creation

- Mark as New
- Bookmark
- Subscribe
- Mute
- Subscribe to RSS Feed
- Permalink
- Report
Hey everyone, I have a request which I cannot figure out how to do myself.
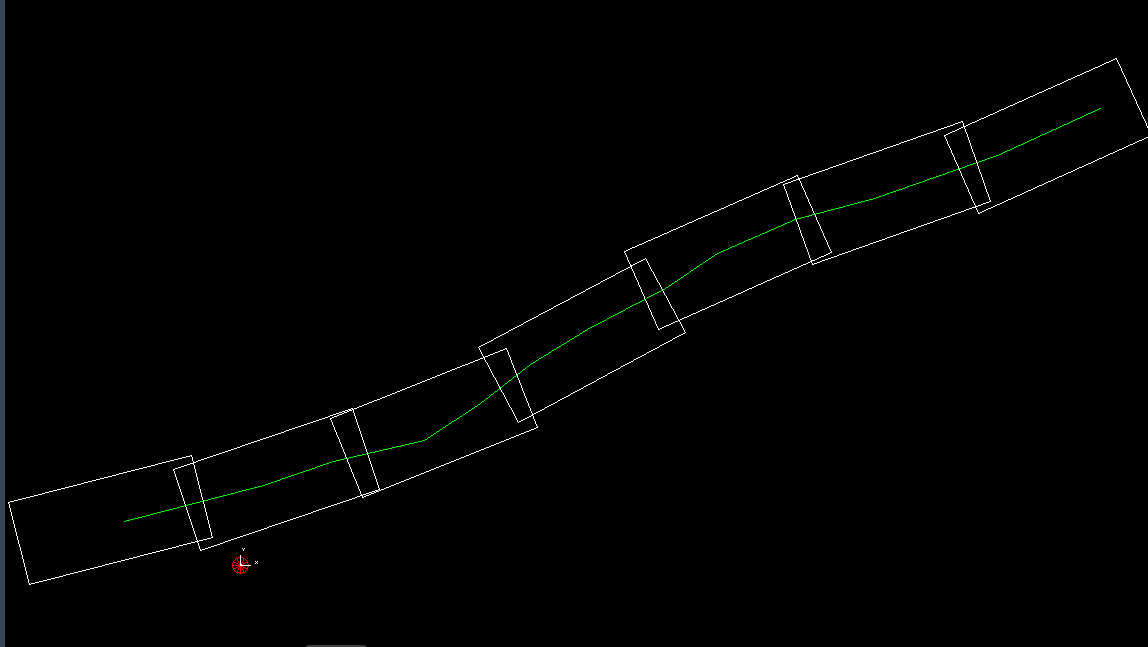
The end product should be the pipeline route divided into Rectangles (PIC_1) inserted into Charts covering the pipeline route and in each one XREFing these charts (bathymetry, Seabed Feature, Isopach, Legend, Keymap) just to edit the XREF once if any updates occurred not having to edit all the charts then then we clip all the XREFs for the designated rectangle used (if we are working on DWG1 we clip to rectangle 1 and so on).
however, we use a specific chart frame (PIC_CHART.png) in which we insert 4 boxes of the overlapped boxes covering the route depending on the direction of the route it will be inserted (because the chart is always horizontal).
then we PDF and bind to deliver the charts and PDFs to client.
If there are better ways doing this, I'm open for ideas.
Also if there is a tool or Autolisp that would be very helpful.
@O_Eckmann @ChicagoLooper @pendean If you can help as you have always done, it would be highly appreciated.