ObjectArx 2019 debugging problem

ObjectArx 2019 debugging problem

zrobert
Advocate Advocate
6,115 Views
23 Replies
Message 1 of 24

ObjectArx 2019 debugging problem

zrobert
Advocate
Advocate

Hi;

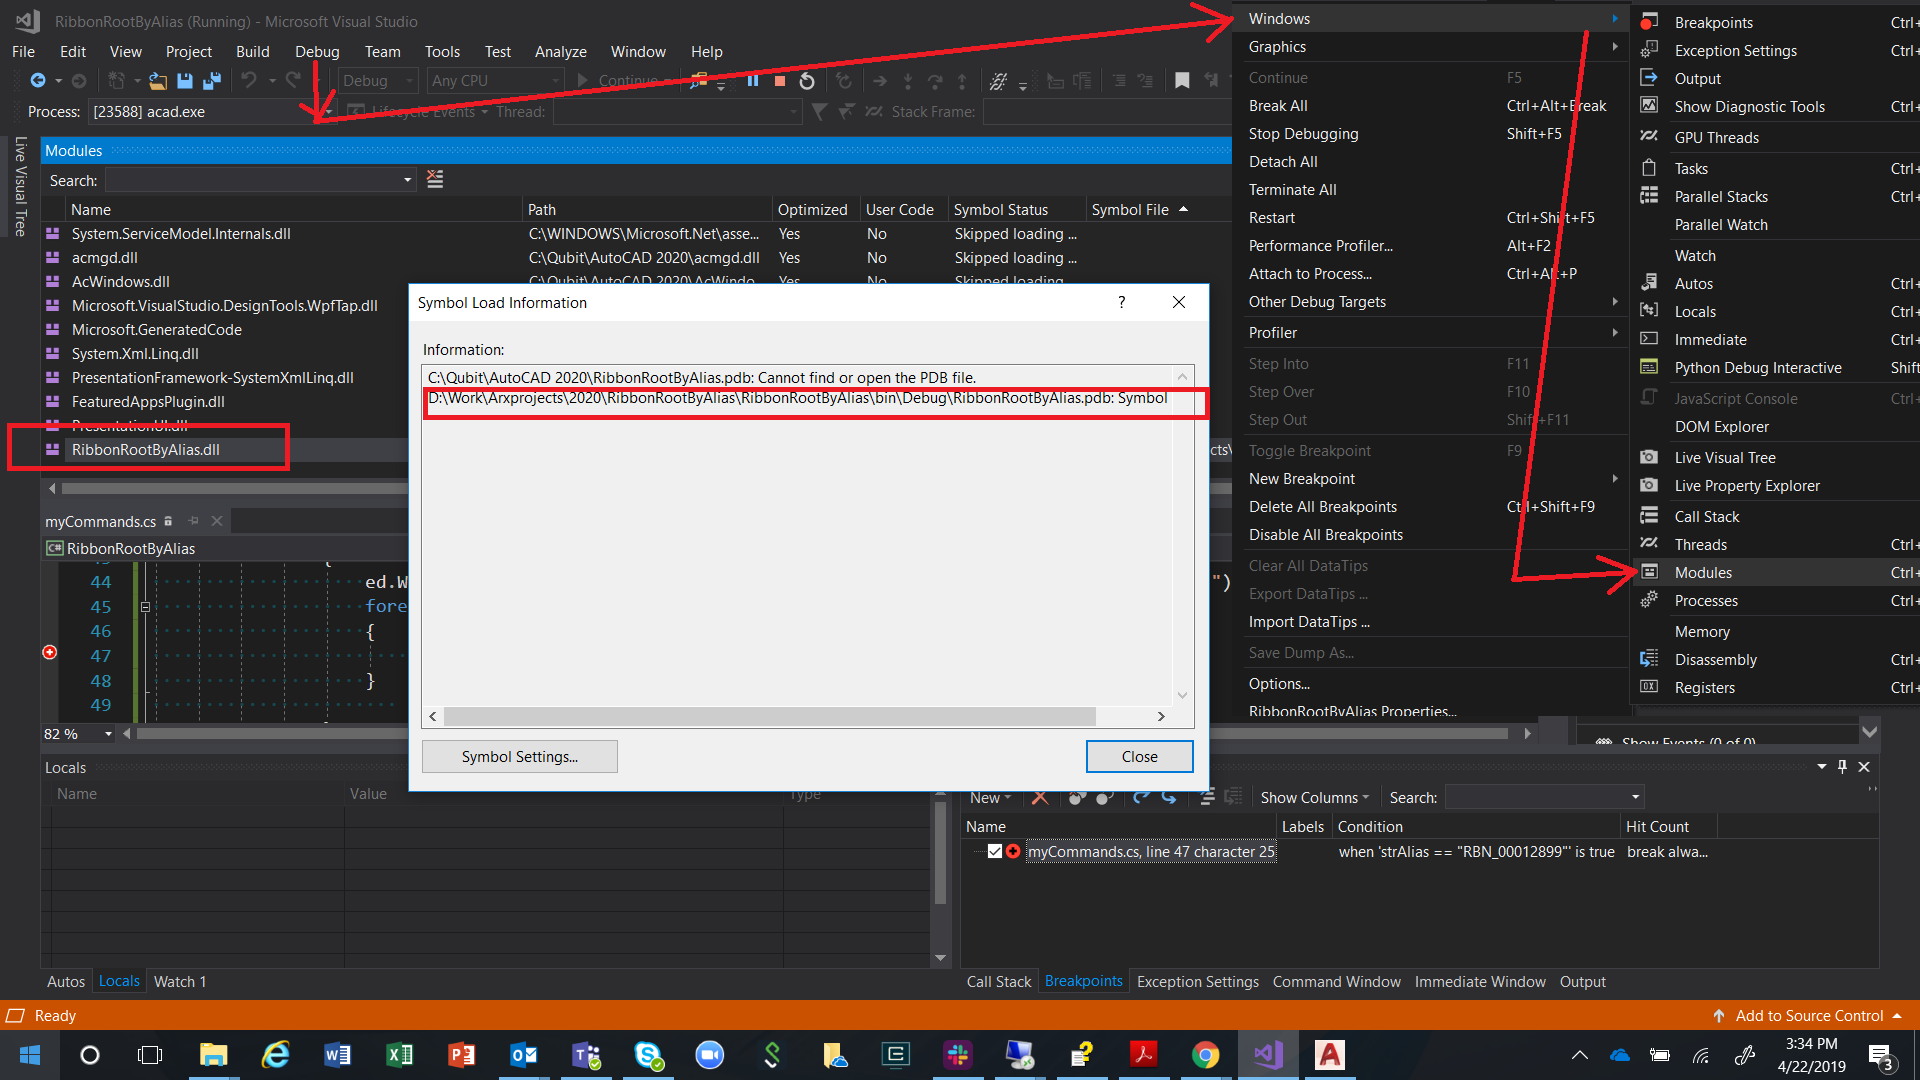
I have a project in version 2018 and I compiled it into version 2019. Everything is ok in the release (or debug) version when it is normally loaded to Acad with the APPLOAD command. However, debugging does not work. Visual studio normally started Autocad, load application, but break points are not hit. I've created a new blank project with ObjectArx wizard 2019, compiled it and the problem is the same. Can not hit a break point. However, when compiling a project from an ObjectArx sample folder, debugging works normally!?! I try to compare this project settings, but cannot found differences (at least as far as I know).

Another thing, a project created with ObjectArx wizard, or a project from arx samples can not compile until I add this line to the project settings file.

<PropertyGroup Label="Configuration">
    <ConfigurationType>DynamicLibrary</ConfigurationType>
    <CharacterSet>Unicode</CharacterSet>
    <CLRSupport>false</CLRSupport>
    <UseOfMfc>Dynamic</UseOfMfc>
    <!-- <UseOfAtl>false</UseOfAtl> -->
    <WindowsTargetPlatformVersion>10.0.16299.0</WindowsTargetPlatformVersion>
<PlatformToolset>v141</PlatformToolset> </PropertyGroup>

Here is example project.


P.S.

I do corrections to ObjectARX wizard 2019 files as sugested Mr. Alexander Rivilis in this post.


Thanks;

0 Likes
Accepted solutions (1)
6,116 Views
23 Replies
Replies (23)
Message 21 of 24

Alexander.Rivilis
Mentor
Mentor

@TEK1 wrote:
Thank you for that reply. I don't get that screen. This is what I get. It
is a C# project
[image: image.png]

This forum is only for "native" C++ and ObjectARX. C# have to be discasised in .NET forum: https://forums.autodesk.com/t5/net/bd-p/152

Відповідь корисна? Клікніть на "ВПОДОБАЙКУ" цім повідомленням! | Do you find the posts helpful? "LIKE" these posts!
Находите сообщения полезными? Поставьте "НРАВИТСЯ" этим сообщениям!
На ваше запитання відповіли? Натисніть кнопку "ПРИЙНЯТИ РІШЕННЯ" | Have your question been answered successfully? Click "ACCEPT SOLUTION" button.
На ваш вопрос успешно ответили? Нажмите кнопку "УТВЕРДИТЬ РЕШЕНИЕ"


Alexander Rivilis / Александр Ривилис / Олександр Рівіліс
Programmer & Teacher & Helper / Программист - Учитель - Помощник / Програміст - вчитель - помічник
Facebook | Twitter | LinkedIn
Expert Elite Member

0 Likes
Message 22 of 24

moogalm
Autodesk Support
Autodesk Support

If you are not able hitting breakpoint for .NET module, either the application is not able to finding the associated PDB or it is located in wrong direction.


After starting the debugger either press CTRL+ALT+U

Or, go to Debug\Windows\Modules

Find your .NET module from the list, right click for Symbol Load Information

Screenshot is attached


ModulesLoad.png


Message 23 of 24

TEK1
Participant
Participant
Thank you
it was a silly question. Break point does come live once netloaded
0 Likes
Message 24 of 24

Anonymous
Not applicable

On the taskbar, click "Project" --> "Properties"


0 Likes