Hi Bermet,
do you run as Dual-Domain or 3D ?
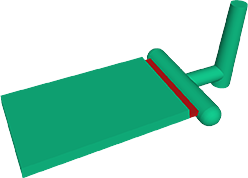
As a circular runner to film gate, 3D captures the chunky area better.
Dual-Domain try to match triangles and assign thickness, so not so good representation of real runner.
Also, in Process Settings, tab Accuracy (a bit hidden - use right arrow to get there) you can increase Analysis model processing resolution. Level 0 (standard). Each level increase number of elements (finer mesh), and for 3D more tetra
layers in thickness direction. Higher resolutions requires more resources, and takes longer to compute as more elements.
Do a test of higher level, to see if results improve.
Is the mold already designed with such a runner?
Assume this is an ISO standard test plaque.
Many times those kind of test plaques has a fan gate.
The Fiber orientation tensor plot you display, is Normalized thickness 1.
This means on surface.
Animating this:
- Normalized thickness 1, surface A
- Normalized thickness 0, middle
- Normalized thickness -1, surface B
Then you have the Average fiber orientation, over time. (for Dual-Domain).
3D has Fiber orientation tensor plot on elements through thickness.
So it also depends on how you compare your real test plaque with results.
Moldflow Insight also has more options to review fiber orientation results.
Have a look in online help for more information: Fiber orientation analysis
Regards,
Berndt
( If my comments are accepted, provide "Kudos" as appreciation. If your request is answered/resolved, please click the "Accept as Solution" button. Thanks.)