How to change data split color on dashboard chart?

How to change data split color on dashboard chart?

nmzenke
Enthusiast Enthusiast
95 Views
1 Reply
Message 1 of 2

How to change data split color on dashboard chart?

nmzenke
Enthusiast
Enthusiast

[ FlexSim 17.2.2 ]

flexsim-question.png

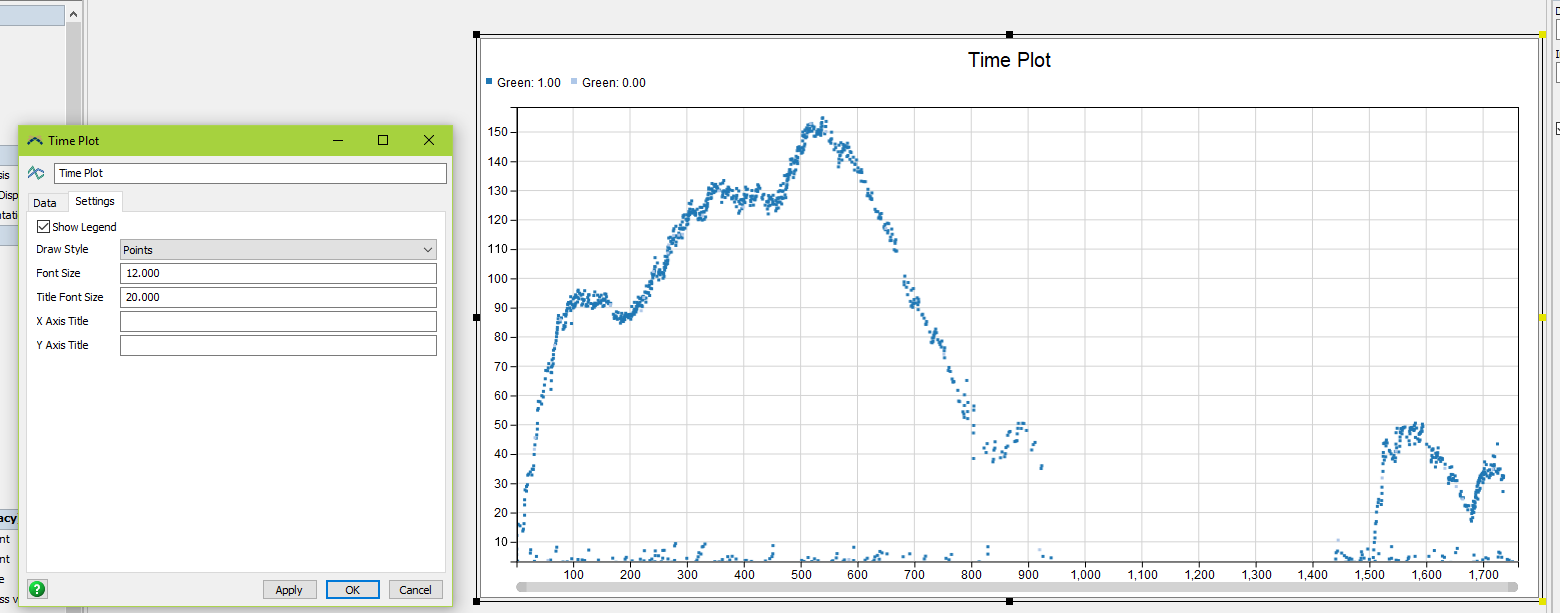
I'm trying to change the color of the points on a Time Plot where I have data split out by a label (see attached screenshot). However, there is no option that I can find to do this. The two colors that FS automatically chooses are blue and light blue so there is not enough contrast in the plot.

0 Likes
Accepted solutions (1)
96 Views
1 Reply
Reply (1)
Message 2 of 2

JordanLJohnson
Autodesk
Autodesk
Accepted solution

In version 18.0 (now available as a beta), the Time Plot and Histogram charts both got a new Colors tab. The colors can be auto-assigned or specified by the user.

In previous versions, you could not change the colors.

.


Jordan Johnson
Principal Software Engineer
>