Experimenter results

Experimenter results

chuoTV3H9
Participant Participant
26 Views
3 Replies
Message 1 of 4

Experimenter results

chuoTV3H9
Participant
Participant

[ FlexSim 19.2.2 ]

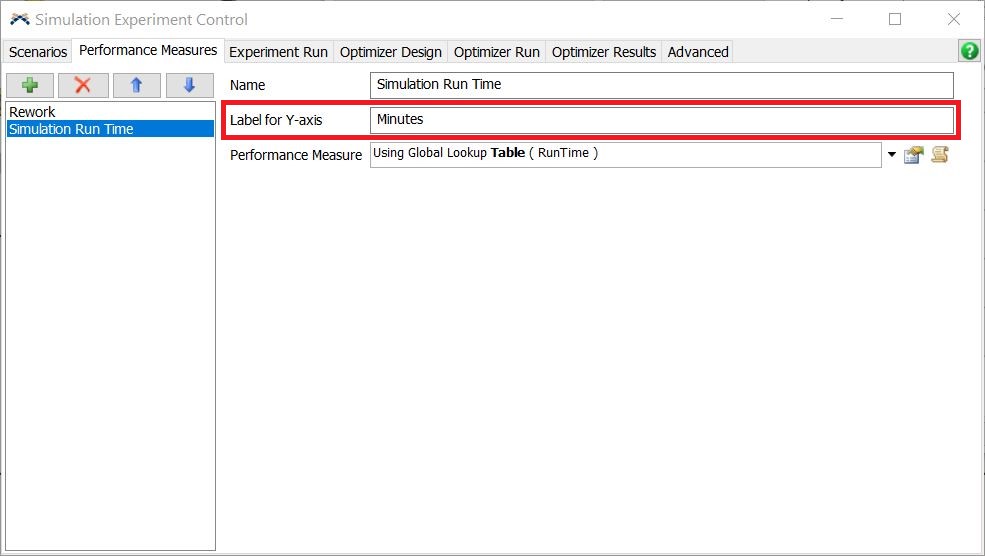
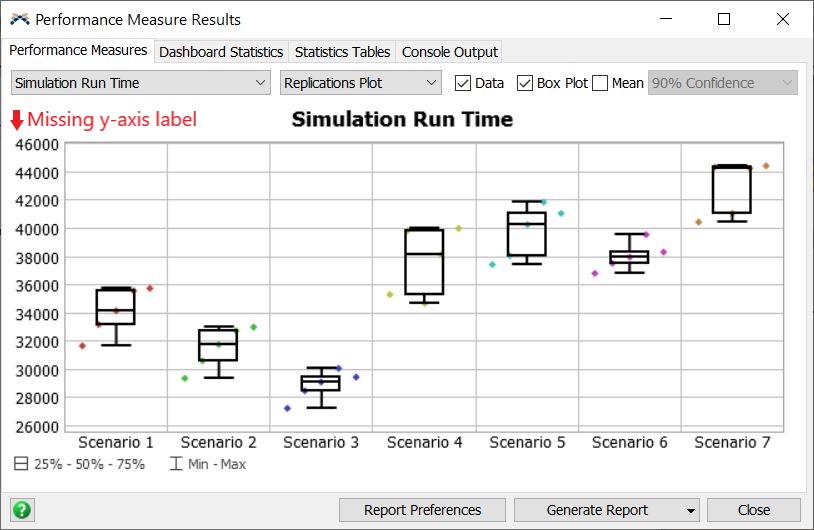
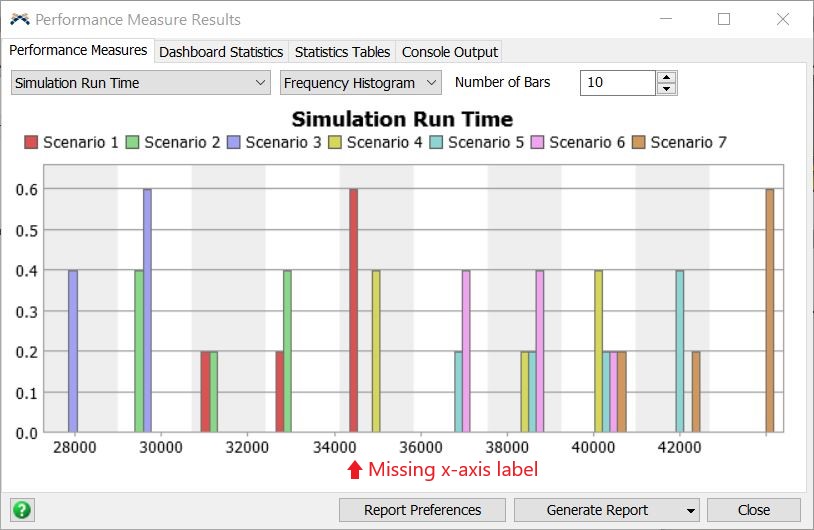
In the Experimenter tool, under the "Performance Measures" tab (performance-measures.jpg), I have specified a label for the y-axis of the plot. However, when viewing the results, the label is not referenced in the y-axis of the replications plot (results1.jpg), nor is it shown in the x-axis of the frequency histogram (results2.jpg).

I'm wondering if this is something that is still in development, or if I missed something to show the units of measure.

Thank you!

0 Likes
Accepted solutions (1)
27 Views
3 Replies
Replies (3)
Message 2 of 4

tanner_p
Not applicable

@Steven C7,

I'm not sure right off the bat if there is a way to show these axis labels. That said, however, you could export the data and add the labels post-experimentation in FlexSim. I know that might require a bit more work, though.

I also notified our stats developer to see what his take is.

0 Likes
Message 3 of 4

chuoTV3H9
Participant
Participant

Thanks @tanner.p

The temporary work-around I'm doing right now is copying the raw data results into a spreadsheet, and processing them in a different software to create the graphs. However, I'm also interested to know what the stats developer thinks.

0 Likes
Message 4 of 4

JordanLJohnson
Autodesk
Autodesk
Accepted solution

This looks like a bug. There is code to draw the y-axis title, but the value to draw is blank, so nothing is drawn. I will put it on the dev list.

.


Jordan Johnson
Principal Software Engineer
>

0 Likes