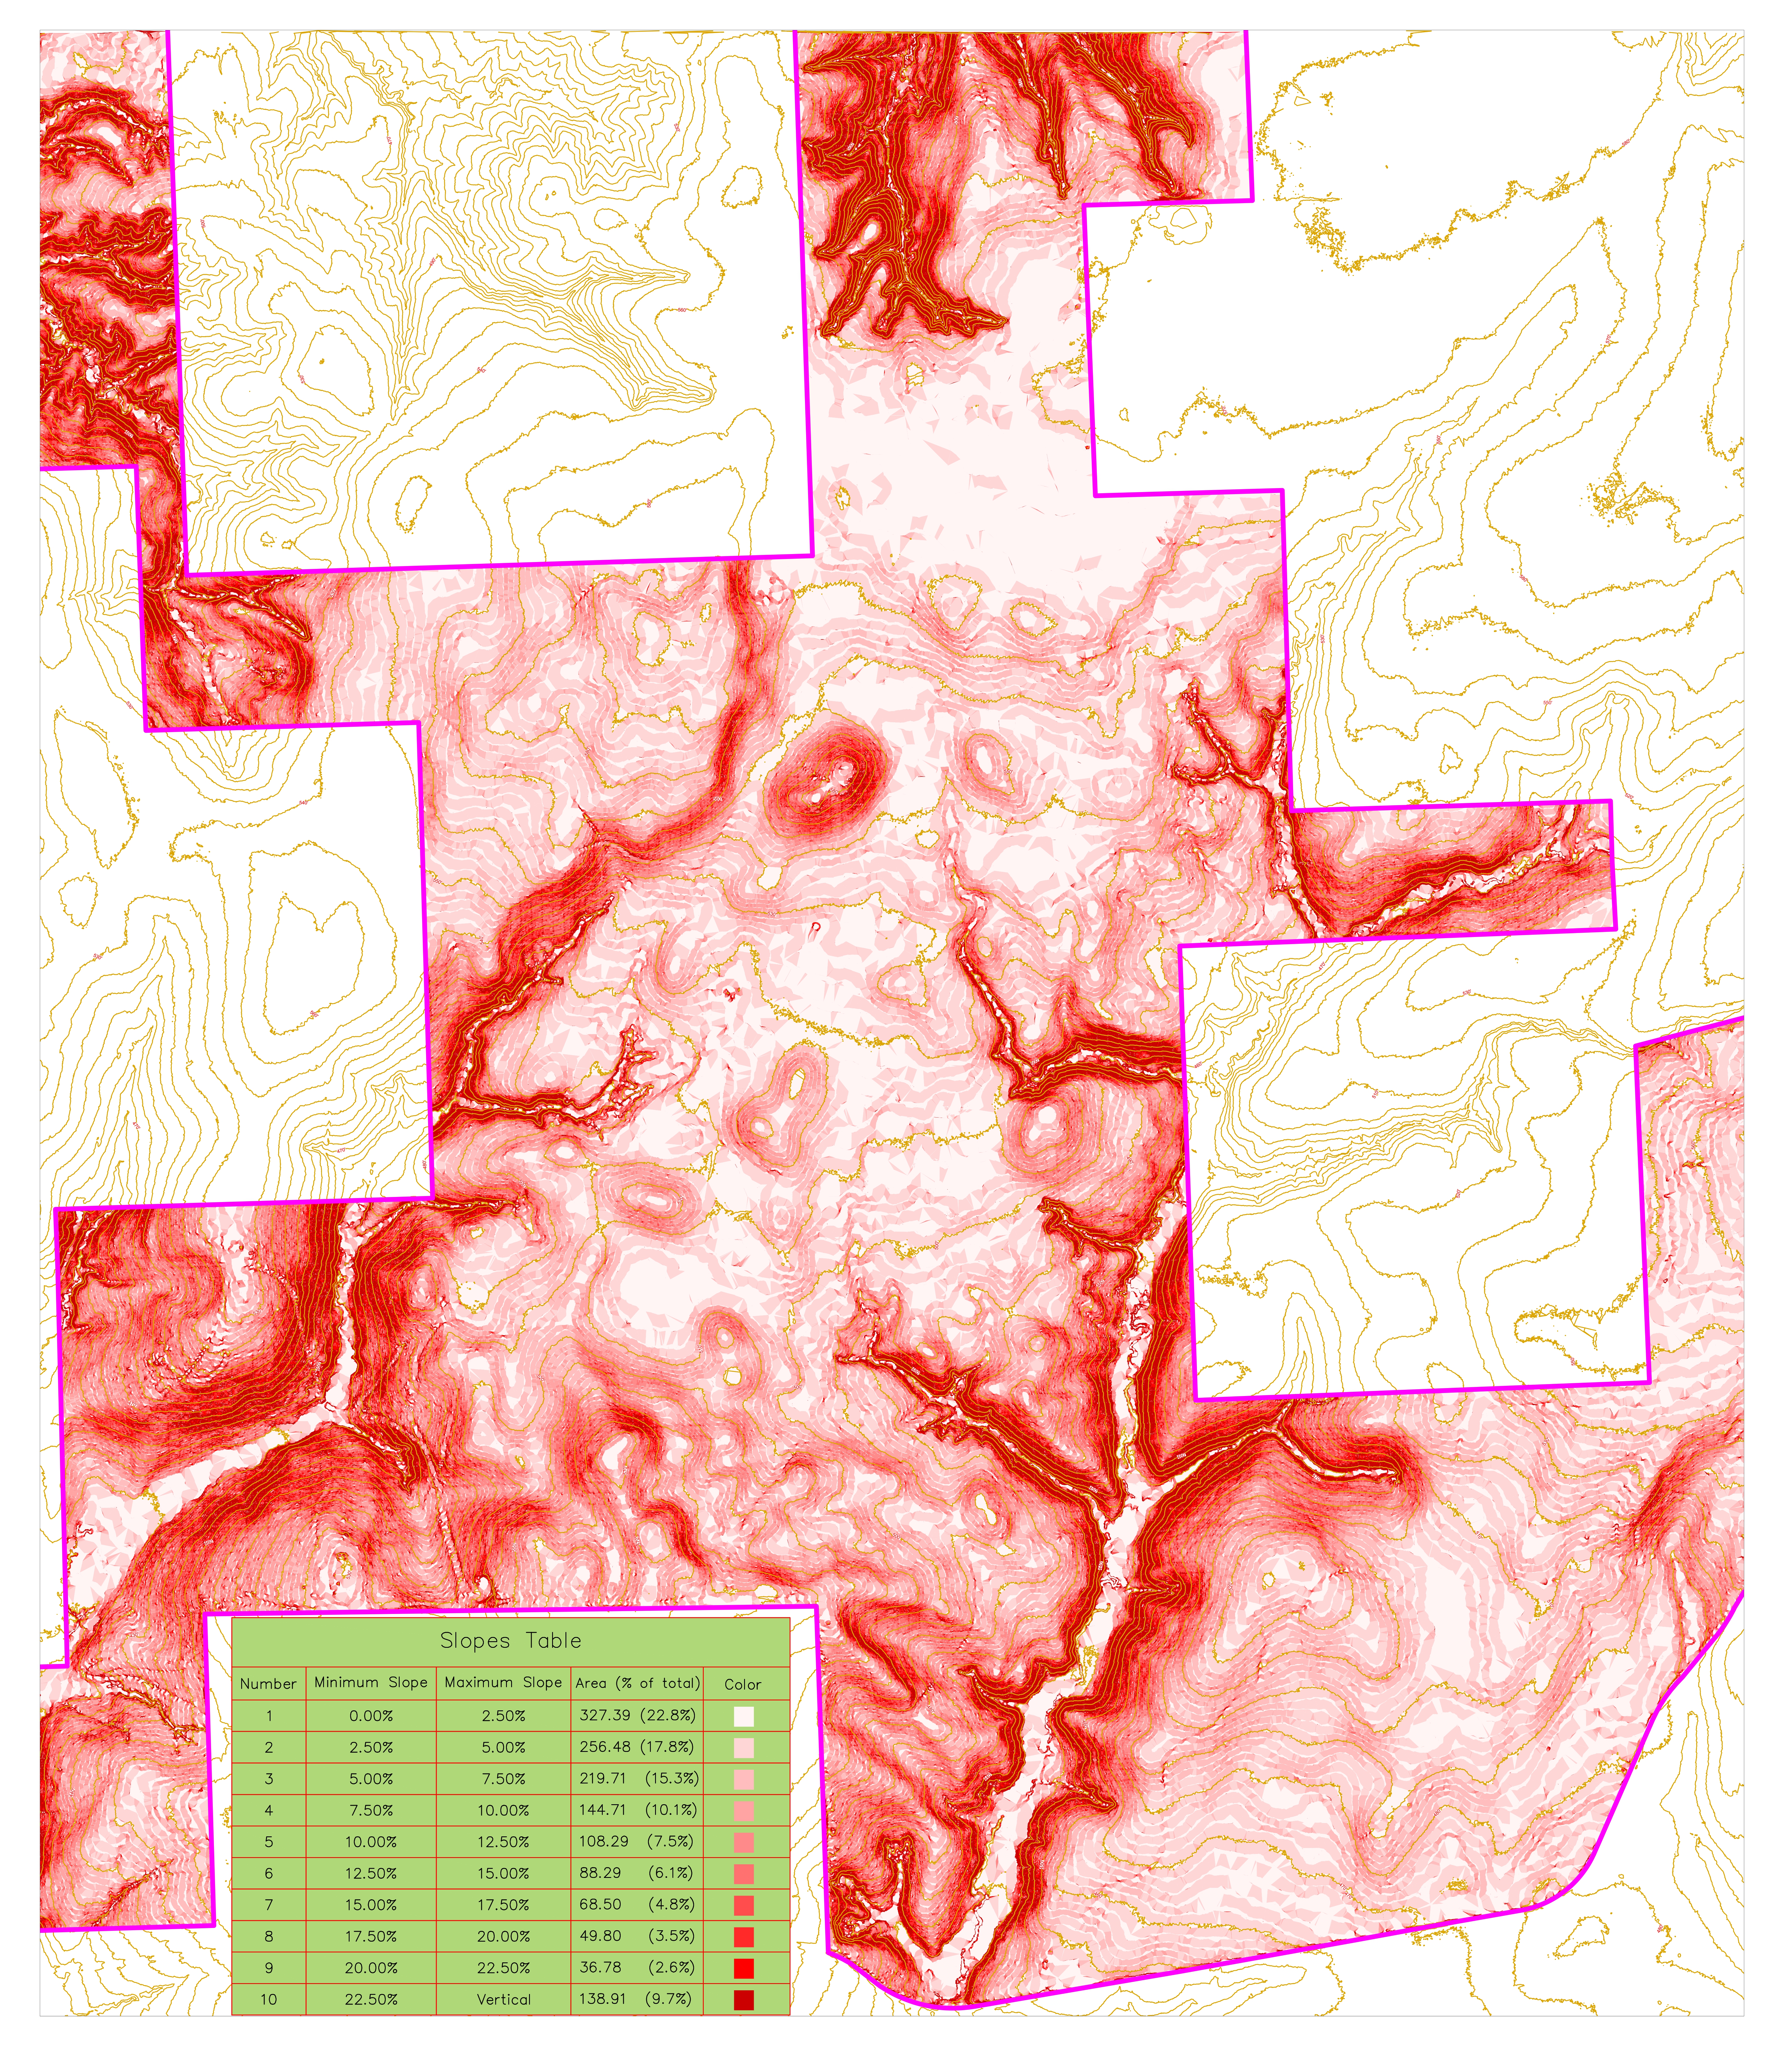
I created a slope model for a section of a property a few weeks ago, yielding the ETX slope model_002 image. The source for the surface was a USGS DEM file, data clipped to the topo area you see, and then an additional surface boundary at the property line.
I returned to make another one, this time for the entire property, using the same DEM file the only difference being I used the property line as the data clip, yielding the ETX slope model_001 image. (I believe I used 'DWG to PDF' to plot both versions and then converted them to images using the same DPI)
My questions are 1- how do these images look so different and 2- how is the area of '0-2.5% slope' so much less in the expanded version?
Thanks in advance for the insight and help!

