Community
- Forums Home
- >
- Robot Structural Analysis Products Community
- >
- Robot Structural Analysis Forum
- >
- Re: Missing labels in Maps on Bars
Robot Structural Analysis Forum
Welcome to Autodesk’s Robot Structural Analysis Forums. Share your knowledge, ask questions, and explore popular Robot Structural Analysis topics.
Turn on suggestions
Auto-suggest helps you quickly narrow down your search results by suggesting possible matches as you type.
Reply
Topic Options
- Subscribe to RSS Feed
- Mark Topic as New
- Mark Topic as Read
- Float this Topic for Current User
- Bookmark
- Subscribe
- Printer Friendly Page
Message 1 of 10
12-20-2011
06:09 AM
- Mark as New
- Bookmark
- Subscribe
- Mute
- Subscribe to RSS Feed
- Permalink
- Report
12-20-2011
06:09 AM
Missing labels in Maps on Bars
Hi.
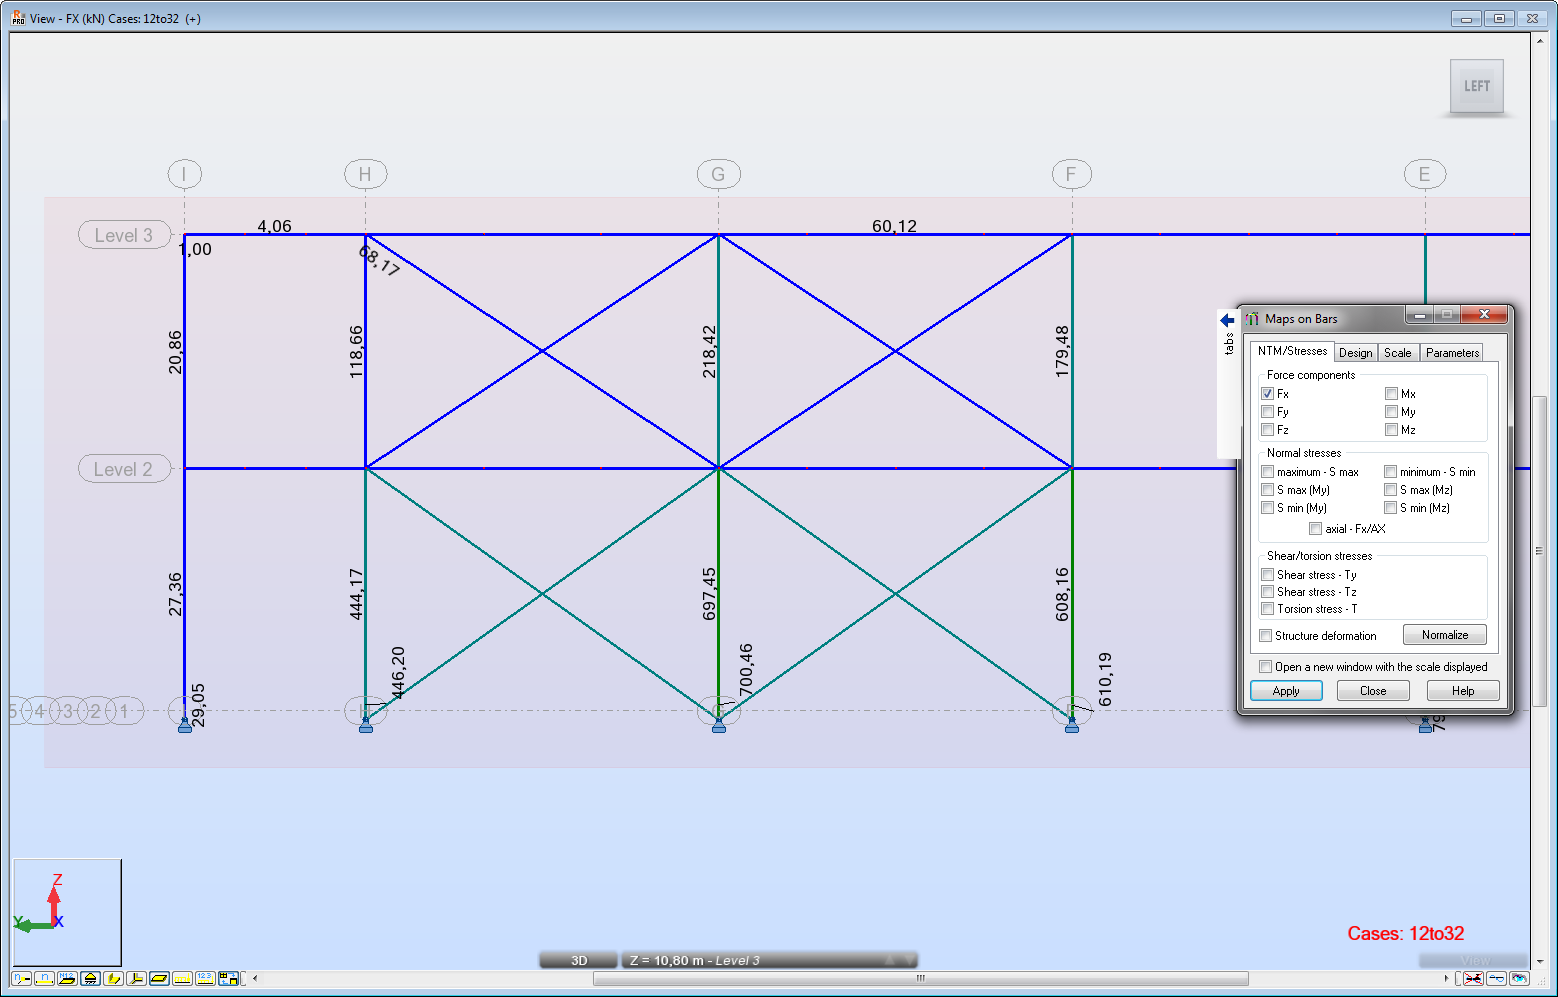
I'm trying to display normal forces in cross bracings in a steel frame structure in a readable way. I want to display an elevation with normal forces and labels on each bar. trying to use the Maps on Bars function I get _some_ of them, but never all of them at once. Why is this so hard, and is there anything I can do to fix it? It's driving me nuts. I've tried zooming in and out, but there are always some forces missing...
Thanks
9 REPLIES 9
Message 2 of 10
12-21-2011
02:17 AM
- Mark as New
- Bookmark
- Subscribe
- Mute
- Subscribe to RSS Feed
- Permalink
- Report

Message 3 of 10
01-18-2012
05:09 AM
- Mark as New
- Bookmark
- Subscribe
- Mute
- Subscribe to RSS Feed
- Permalink
- Report
01-18-2012
05:09 AM
Hi.
This problem was put on hold along with my project before christmas. Now I'm back at it, and the problem remains unsolved. I know about moving labels, but it doesn't help much when several bars meet (attached image). Using text I avoid this, but but it gets real messy (attached image), and it takes a lot of time cleaning it up when I have eight braces.
Is there really no solution to this? I just want the maximum value for each bar, graphically displayed for easy reading...
Message 4 of 10
02-08-2013
03:03 AM
- Mark as New
- Bookmark
- Subscribe
- Mute
- Subscribe to RSS Feed
- Permalink
- Report
02-08-2013
03:03 AM
Maybe this can help:
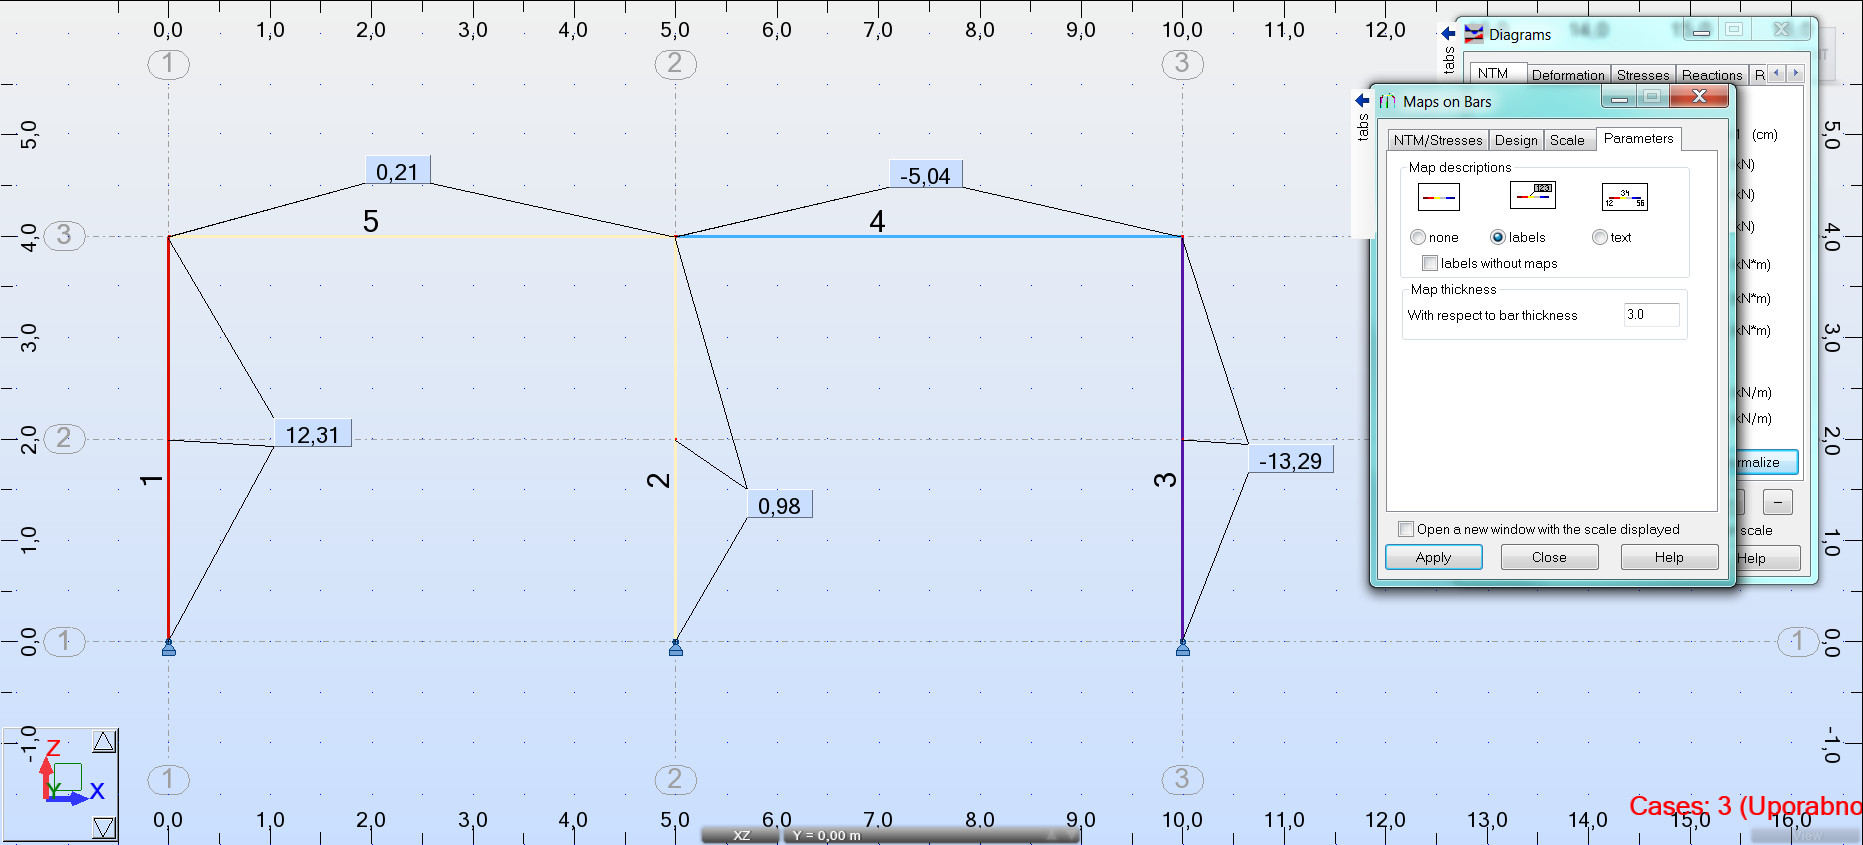
I've added additional nodes on bars and Robot displays "labels" (values) in nodes. See image attached.
My question: is there any other way to display additional values for diagrams. Let's say that Robot displays diagram value at beggining and the end of the element but I want also to see value in the middle, or at any other place. Is there a way to display additional value without adding a node at that place?
Something like when displaying maps for surface elements - there is possible to display value at specific point.
If this solved your issue, please Accept it as Solution help other forum users with similar issues to find answers easily.
Mirko Jurcevic
My blog: www.engipedia.com
Try my Revit add-ins: Autodesk App Store
Mirko Jurcevic
My blog: www.engipedia.com
Try my Revit add-ins: Autodesk App Store
Message 5 of 10
02-08-2013
04:08 AM
- Mark as New
- Bookmark
- Subscribe
- Mute
- Subscribe to RSS Feed
- Permalink
- Report
02-08-2013
04:08 AM
I've added additional nodes on bars and Robot displays "labels" (values) in nodes. See image attached.
My question: is there any other way to display additional values for diagrams. Let's say that Robot displays diagram value at beggining and the end of the element but I want also to see value in the middle, or at any other place. Is there a way to display additional value without adding a node at that place?
No. As you mentioned - add nodes.
Rafal Gaweda
Message 6 of 10
02-08-2013
04:31 AM
- Mark as New
- Bookmark
- Subscribe
- Mute
- Subscribe to RSS Feed
- Permalink
- Report
02-08-2013
04:31 AM
That's bad.
And what if I don't know in advance where I'll need to put nodes.
Process would be:
calculate model -> find places where you need additional values -> remember/write down positions of additional nodes -> add nodes -> calculate again -> find out that you missed something -> swear -> add nodes -> calculate again
And imagine what if you need half an hour for each calculation.
I don't know, there got to be an easier way to do this.
And what when I right click to diagram value text and delete it? How can I get it back?
If this solved your issue, please Accept it as Solution help other forum users with similar issues to find answers easily.
Mirko Jurcevic
My blog: www.engipedia.com
Try my Revit add-ins: Autodesk App Store
Mirko Jurcevic
My blog: www.engipedia.com
Try my Revit add-ins: Autodesk App Store
Message 7 of 10
02-08-2013
04:41 AM
- Mark as New
- Bookmark
- Subscribe
- Mute
- Subscribe to RSS Feed
- Permalink
- Report
02-08-2013
04:41 AM
I've found out: And what when I right click to diagram value text and delete it? How can I get it back?
View -> Descriptions -> Restore Deleted Descriptions
If this solved your issue, please Accept it as Solution help other forum users with similar issues to find answers easily.
Mirko Jurcevic
My blog: www.engipedia.com
Try my Revit add-ins: Autodesk App Store
Mirko Jurcevic
My blog: www.engipedia.com
Try my Revit add-ins: Autodesk App Store
Message 8 of 10
02-08-2013
04:51 AM
- Mark as New
- Bookmark
- Subscribe
- Mute
- Subscribe to RSS Feed
- Permalink
- Report
02-08-2013
04:51 AM
And what if I don't know in advance where I'll need to put nodes.
Use Detailed Analysis : http://screencast.com/t/uiKgsVAM0Ewd
Rafal Gaweda
Message 9 of 10
02-08-2013
05:53 AM
- Mark as New
- Bookmark
- Subscribe
- Mute
- Subscribe to RSS Feed
- Permalink
- Report
02-08-2013
05:53 AM
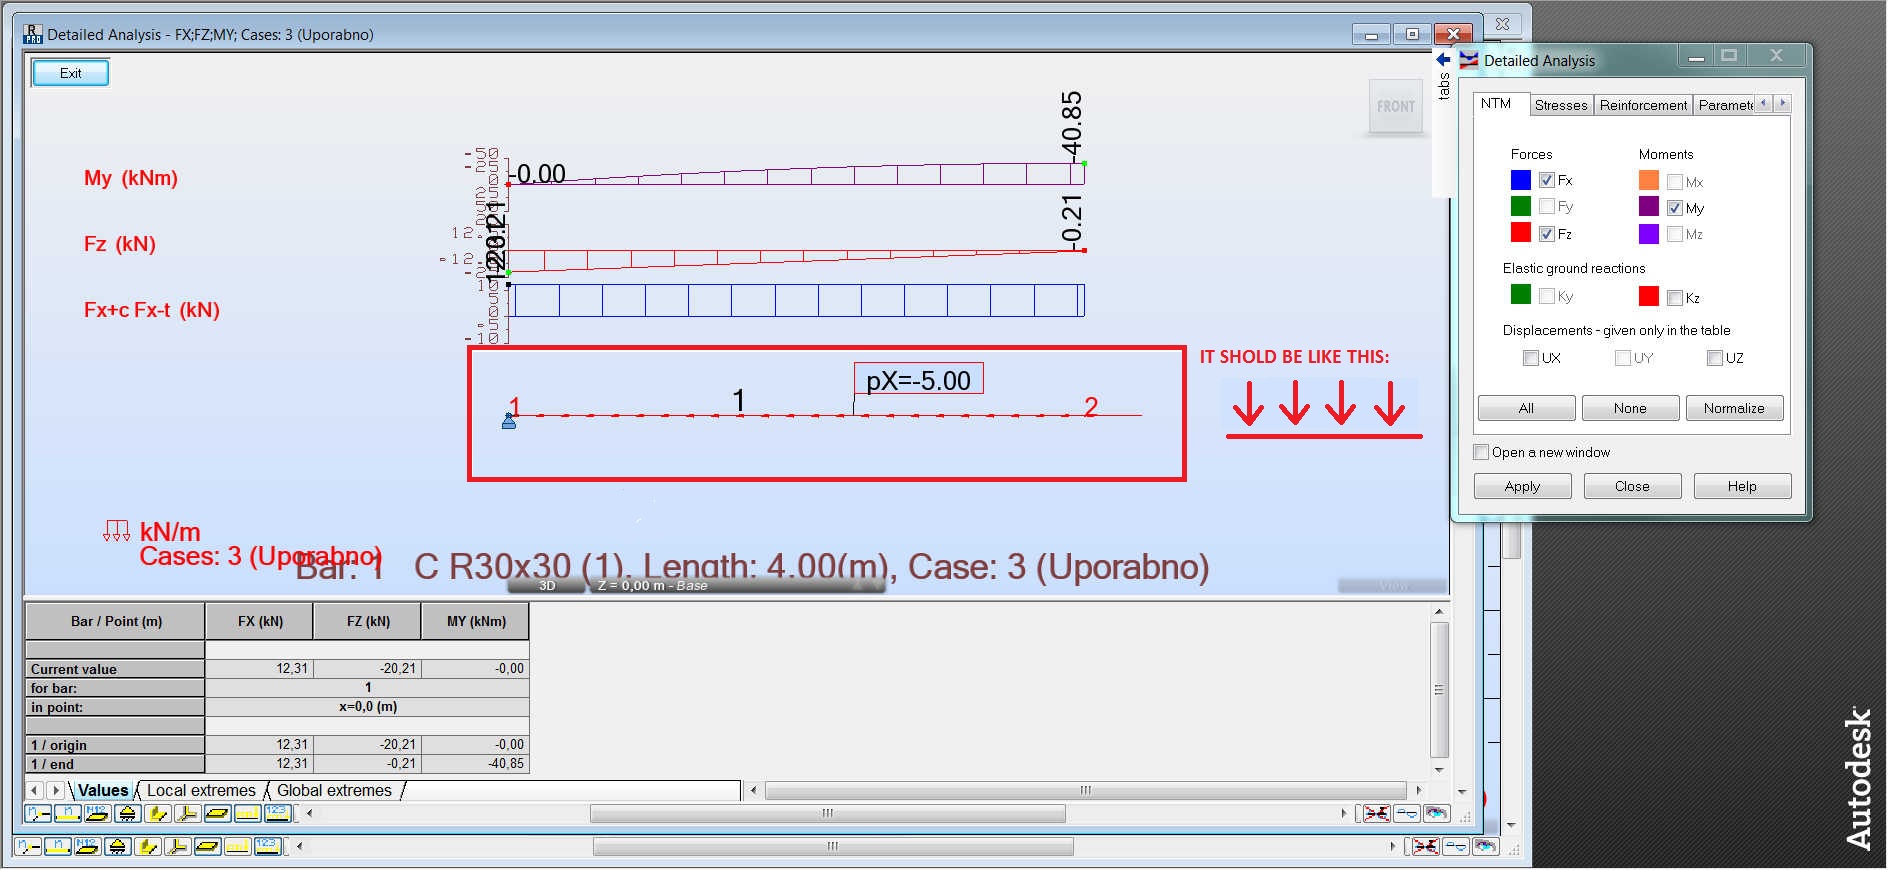
Thanks, that's useful! ![]()
Screen capture takes diagrams+table at the same time, which is good.
But, I don't have that vertical blue bar for reading values.
And, on my sample model, when I insert column in detailed analysis I get wrong direction of load forces.
Look at the images attached.
If this solved your issue, please Accept it as Solution help other forum users with similar issues to find answers easily.
Mirko Jurcevic
My blog: www.engipedia.com
Try my Revit add-ins: Autodesk App Store
Mirko Jurcevic
My blog: www.engipedia.com
Try my Revit add-ins: Autodesk App Store
Message 10 of 10
02-08-2013
06:09 AM
- Mark as New
- Bookmark
- Subscribe
- Mute
- Subscribe to RSS Feed
- Permalink
- Report
02-08-2013
06:09 AM
And, on my sample model, when I insert column in detailed analysis I get wrong direction of load forces.
Thx for reporting. I will registser it for correction.
Rafal Gaweda
Reply
Topic Options
- Subscribe to RSS Feed
- Mark Topic as New
- Mark Topic as Read
- Float this Topic for Current User
- Bookmark
- Subscribe
- Printer Friendly Page
