Community
Civil 3D Forum
Welcome to Autodesk’s Civil 3D Forums. Share your knowledge, ask questions, and explore popular AutoCAD Civil 3D topics.
Turn on suggestions
Auto-suggest helps you quickly narrow down your search results by suggesting possible matches as you type.
Reply
Topic Options
- Subscribe to RSS Feed
- Mark Topic as New
- Mark Topic as Read
- Float this Topic for Current User
- Bookmark
- Subscribe
- Printer Friendly Page
Message 1 of 5
10-09-2012
01:48 PM
- Mark as New
- Bookmark
- Subscribe
- Mute
- Subscribe to RSS Feed
- Permalink
- Report
10-09-2012
01:48 PM
Should be an easy question. But I don't know the answer.
We will be doing some grading in a park with trees. Probably maximum depth or fill of 12 inches. The question has come up to be able to show cut and fill quantities as a visual shade of colors. I have a way to display cut and fill ticks and it will give me the value, but that's not what they want. I change the cut ticks to red and the fill ticks to green. What is the best way to represent this like when you turn on slope percentages and assign different colors. but I want like 0-2" fill to be red, 2" - 4" to be green, etc.
Thanks in advance.
Solved! Go to Solution.
Solved by jmayo-EE. Go to Solution.
4 REPLIES 4
Message 2 of 5
10-09-2012
02:03 PM
- Mark as New
- Bookmark
- Subscribe
- Mute
- Subscribe to RSS Feed
- Permalink
- Report
10-09-2012
02:03 PM
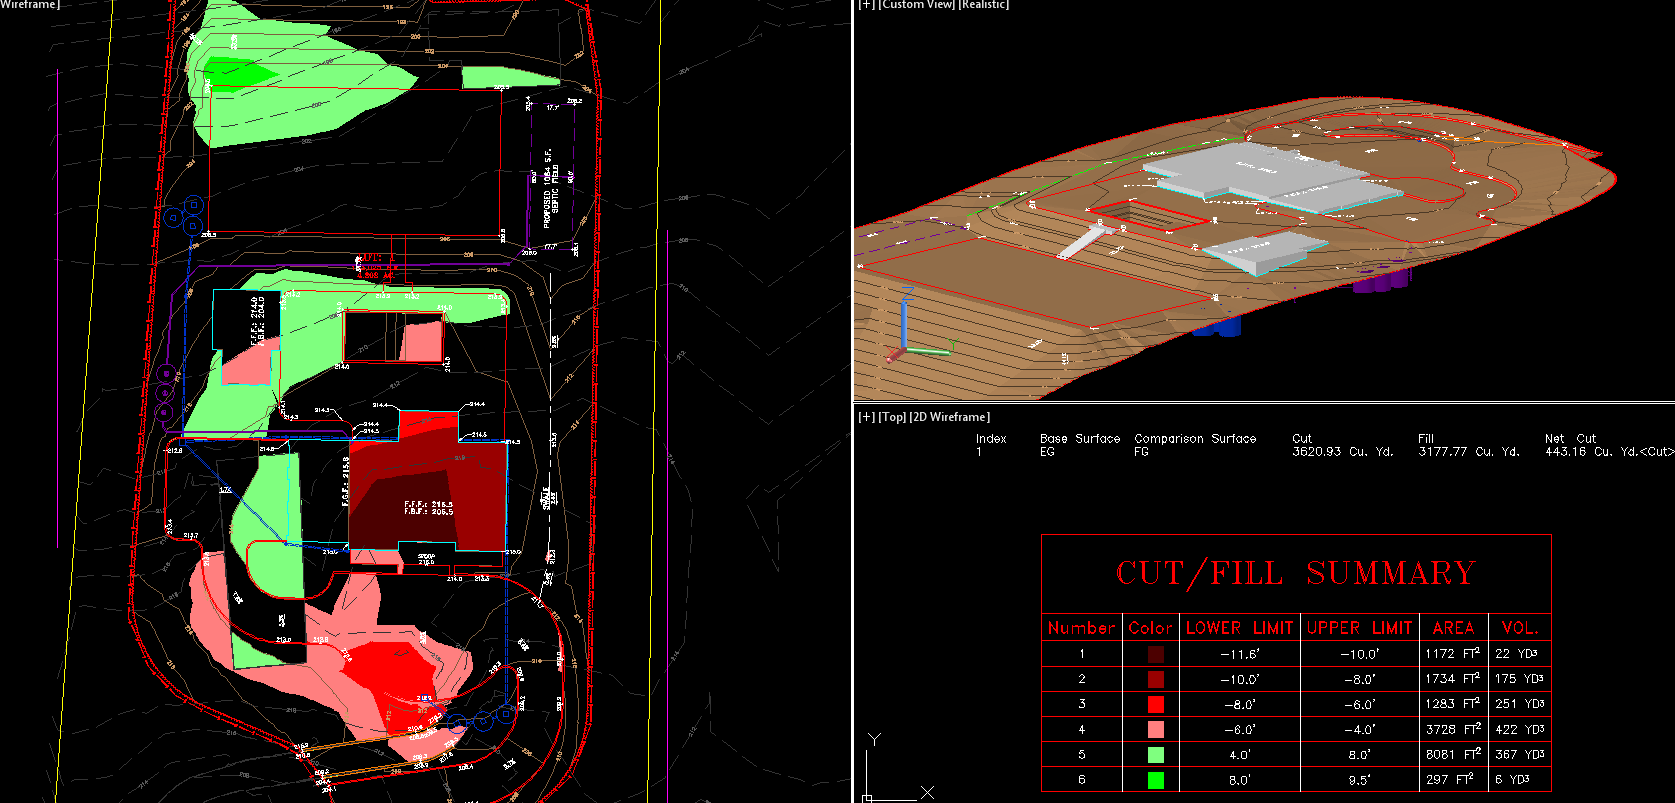
I'm working with one now.
You need an Elevation Analysis performed on the surface not a slope analysis. You will also need a surface style that displays the elevation banding. Finally create a table style for the banding.
John Mayo
Message 4 of 5
10-31-2012
07:13 AM
- Mark as New
- Bookmark
- Subscribe
- Mute
- Subscribe to RSS Feed
- Permalink
- Report
10-31-2012
07:13 AM
John,
Thanks for the advice. It's working well. How do I get the cut and fill quantities to be placed in the drawing instead of just the panarama window.? Is that a table you created? Is it dynamic?
Thanks,
T
Message 5 of 5
11-01-2012
09:55 AM
- Mark as New
- Bookmark
- Subscribe
- Mute
- Subscribe to RSS Feed
- Permalink
- Report
11-01-2012
09:55 AM
Select the surface, on the Ribbon click the Tables button. Follow the prompts on the command line to make a dynamic elevation table.
John Mayo
Reply
Topic Options
- Subscribe to RSS Feed
- Mark Topic as New
- Mark Topic as Read
- Float this Topic for Current User
- Bookmark
- Subscribe
- Printer Friendly Page
Forums Links
Can't find what you're looking for? Ask the community or share your knowledge.
Post to forums

