Community
- Forums Home
- >
- Community Archive - Read Only
- >
- Simulation Mechanical Community
- >
- Simulation Mechanical Forum
- >
- Modal shape graphs
Simulation Mechanical Forums (Read-Only)
Welcome to Autodesk’s Simulation Mechanical Forums. Share your knowledge, ask questions, and explore popular Simulation Mechanical topics.
Turn on suggestions
Auto-suggest helps you quickly narrow down your search results by suggesting possible matches as you type.
Reply
Topic Options
- Subscribe to RSS Feed
- Mark Topic as New
- Mark Topic as Read
- Float this Topic for Current User
- Bookmark
- Subscribe
- Printer Friendly Page
Message 1 of 2
09-11-2012
05:42 AM
- Mark as New
- Bookmark
- Subscribe
- Mute
- Subscribe to RSS Feed
- Permalink
- Report
09-11-2012
05:42 AM
Modal shape graphs
is it possible to get a graph (displacement v time) of the modal shapes from the results of a modal analysis.
1 REPLY 1
Message 2 of 2
09-11-2012
09:17 AM
- Mark as New
- Bookmark
- Subscribe
- Mute
- Subscribe to RSS Feed
- Permalink
- Report
09-11-2012
09:17 AM
Hi Edward,
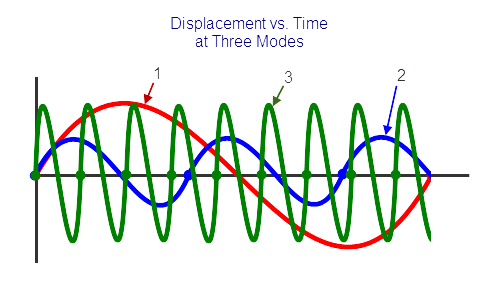
I think the software cannot produce such a graph, but it should be relatively easy to create such graphs in Excel. If you were to plot one node at three different frequencies, it would look like the attached.
Out of curiousity, what would you use such a graph for?
Reply
Topic Options
- Subscribe to RSS Feed
- Mark Topic as New
- Mark Topic as Read
- Float this Topic for Current User
- Bookmark
- Subscribe
- Printer Friendly Page
