Hi Todd,
I think I understand your description. If all of the multipliers are the same, the steady state results in two identical models should be equal regardless of which step the equal multipliers occur in.
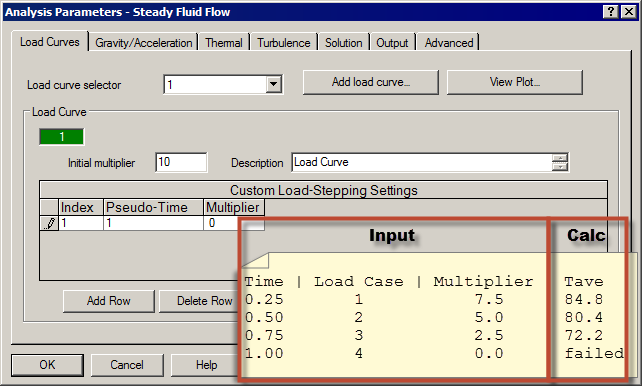
I did a test model, and my results are close. For my coupled analysis parameters, I had gravity values of 0 so that the buoyancy effect would not affect the analysis. I setup 4 time steps in one second. Just like you, I changed the fluid flow multipliers. In one case they go from 0 to 10, and in the other case, they go from 10 to 0. The attached images show the fluid flow Parameters dialog and the average temperature results. In summary:
Fluid multiplier | Average temperature from 2 models
2.5 | 72.2 versus 72.1
5.0 | 80.4 versus 80.2
7.5 | 84.8 versus 84.8
10.0 | ??? versus 87.6
In my model, the fluid is heating the container. So as the velocity (multiplier) increases, the fluid is able to heat more of the container, so the temperature should increase. (And it does.)
I believe the temperatures do not match exactly because fluid flow is an iterative solution, and each model is approaching the theoretical / numerical solution from opposite directions. With more steps or finer tolerance, the two results should converge.
In your "descending / ascending" graph, the results are so close to 0 that it may be hard to draw a conclusion.
To elaborate on a few things (in case someone reads this at a later time), the initial multiplier CAN affect the analysis. Although the calculation is not performed at time 0, the multiplier after time 0 is interpolated from the initial multiplier and the input on the first row of the spreadsheet. If the first time interval has only one time step, then the initial multiplier has no effect. If the first time interval has multiplie time steps (as in my example), the initial multiplier is used in the interpolation.
The Report tab gives three "Log" files.
- The one with the header "Simulation Steady-State Heat Transfer" is from the heat transfer analysis.
- The one without a header if from the fluid analysis. It is the same file that is shown when performing a pure fluid flow analysis and therefore gives additional information about the convergence of the fluid analysis which can help debug a model. (Specifically, the convergence rates of the three velocities and the pressure, etc. This log file is described on the page "Performing Fluid Flow Analyses".) Unfortunately, this log file only gives the last time step. It looks like it gets overwritten on each step instead of appended.
- The one labeled "Simulation Steady Coupled Fluid Flow and Thermal Analyses" in the header gives the convergence rate of the velocity and temperatures from one iteration to the next.
I'm running out of time for now, so I did not have time to look this up. For regular fluid low, the convergence type can be changed (somewhere) from a relative value to an absolute value. In low velocity situations -- cases where they buoyancy is important -- I find it helpful to change the tolerance type from the default of relative to absolute (or incremental). I have seen cases where the calculated velocity should be small (let's say 1), the relative norm converges to its tolerance (let's say 1E-4), but the absolute/incremental velocity norm is large (let's say 0.5). A large absolute/incremental norm indicates that the velocity is varying by plus or minus 0.5 units. This is insignificant if the velocity is 1000 but very significant (a large error) if the velocity is supposed to be 1!
Fifteen years and I'm still learning about the software! I hope that doesn't discourage anyone. 🙂


