Community
Civil 3D Forum
Welcome to Autodesk’s Civil 3D Forums. Share your knowledge, ask questions, and explore popular AutoCAD Civil 3D topics.
Turn on suggestions
Auto-suggest helps you quickly narrow down your search results by suggesting possible matches as you type.
Reply
Topic Options
- Subscribe to RSS Feed
- Mark Topic as New
- Mark Topic as Read
- Float this Topic for Current User
- Bookmark
- Subscribe
- Printer Friendly Page
Message 1 of 37
Anonymous
1473 Views, 36 Replies
11-22-2012
11:51 PM
- Mark as New
- Bookmark
- Subscribe
- Mute
- Subscribe to RSS Feed
- Permalink
- Report
11-22-2012
11:51 PM
Help About Earthworks Fill
I am working in earthworks cut and fill project and the client wants us to submit an increment of 15cm filling to be tested for compaction before adding another 15cm until design levels.
I have known the fill area by subtracting the surfaces...my base point is EG(existing ground from topo) and target surface is the deisgn levels surface. I make analysis for the volume and set one color for cut ("-" values) and ranged the fill every 15cm.
But the client wants is starting from EG, fill an 15cm and show it in drawing for approval. The drawing will include AREA and Volume. It is seems like showing another file and editing the analysis to just one range and put it 0-15, however the outcome is not the same like in the master fill range i make. My understanding is..the lowest range (ex. 1.35-1.50) will be the highest fill therefore this is the one first to be filled on ground...please help me with this one.
I have seen this volume dashboard technique by adding a plane surface to be raised every increment which is the accurate idea but I can not gather the exact elevation of my volume (subtracted surface = EG - Des) contours. My lowest point is 15.661...so my expecting volume contour will all be higher than that elevation.How can I locate the true elevation of the volume contour, not like the 0, 0.15, 0.30....etc.?
Please help...
36 REPLIES 36
Message 2 of 37
11-23-2012
03:15 AM
- Mark as New
- Bookmark
- Subscribe
- Mute
- Subscribe to RSS Feed
- Permalink
- Report
11-23-2012
03:15 AM
Not totally sure what you require here but if your lowest point is 15.661 you could generate user contours at 15.661+0.15, 15.661+0.3, 15.661+0.45 etc etc.
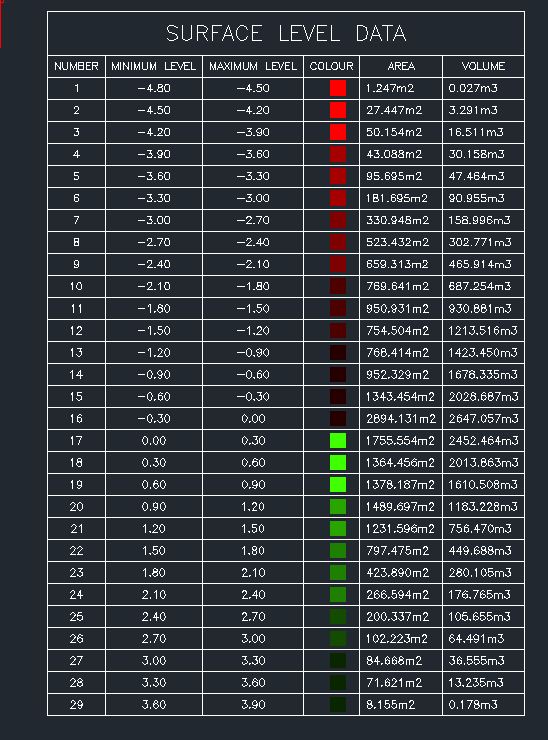
A volume surface table can show the areas and volumes on an interval (0.15 in this case) basis (attached screenshots of one I did last year) although the output needs to be interpeted to make sense.
The fill area reported by Civil 3d for 0-0.3 interval is 1755.554 but this is ONLY an "annular" area i.e. the actual area is the total of all the areas i.e. 9174.453 (see VolumeAreaInterpretation.jpg). The volume reported for each interval is correct however
neilyj (No connection with Autodesk other than using the products in the real world)
Did you find this post helpful? Feel free to Like this post.
Did your question get successfully answered? Then click on the ACCEPT SOLUTION button.
AEC Collection 2025 UKIE (mainly Civil 3D UKIE and IW)
Win 11 Pro x64, 1Tb Primary SSD, 1Tb Secondary SSD
64Gb RAM Intel(R) Xeon(R) W-11855M CPU @ 3.2GHz
NVIDIA RTX A5000 16Gb, Dual 27" Monitor, Dell Inspiron 7760
Message 3 of 37
11-23-2012
03:33 AM
- Mark as New
- Bookmark
- Subscribe
- Mute
- Subscribe to RSS Feed
- Permalink
- Report
11-23-2012
03:33 AM
thanks for the reply sir,
what really require in my drawing is the total area for fill at each 15cm interval. The thing is, I have already submitted a master drawing with volume and area for fill range using the elevation analysis which I put an interval of 15cm.
However I could not explain the area computation of this, upon investigating, I assumed that the bottom values (ex.1.35-1.45 or 3.6-3.9 in your attached table) is the highest fill. Where as 0-.15cm should be the smallest area possible because this is the deepest on ground. And if we add another fill layer, the area will be computed including the area of first layer.
Please enlighten me.
Message 4 of 37
11-23-2012
03:47 AM
- Mark as New
- Bookmark
- Subscribe
- Mute
- Subscribe to RSS Feed
- Permalink
- Report
11-23-2012
03:47 AM
In my screenshot VolumeAreaInterpretation.jpg illustrating a conceptual section through an earthworks fill:
The deepest fill is at the bottom of the sketch but the area reported by Civil 3D is the "annulus" shown in brown whereas the correct area for this first fill interval is actually the sum of all the coloured areas + the area shown as a solid white thick line.
Similarly the next fill interval (magenta) is the sum of the magenta + all the coloured areas above + the area shown as a solid white thick line. This logic is also demonstrated in the Excel screenshot and a similar principle applies to cut areas - again as demonstrated in the Excel screenshot
I am always a bit wary of reporting these areas as there is much scope for errors of interpretation.....
neilyj (No connection with Autodesk other than using the products in the real world)
Did you find this post helpful? Feel free to Like this post.
Did your question get successfully answered? Then click on the ACCEPT SOLUTION button.
AEC Collection 2025 UKIE (mainly Civil 3D UKIE and IW)
Win 11 Pro x64, 1Tb Primary SSD, 1Tb Secondary SSD
64Gb RAM Intel(R) Xeon(R) W-11855M CPU @ 3.2GHz
NVIDIA RTX A5000 16Gb, Dual 27" Monitor, Dell Inspiron 7760
Message 5 of 37
11-23-2012
04:03 AM
- Mark as New
- Bookmark
- Subscribe
- Mute
- Subscribe to RSS Feed
- Permalink
- Report
11-23-2012
04:03 AM
My understanding is since we are in bakcfilling, "0" point surface will start in ground. So if it says 0-0.15 this is the first layer of 15cm fill from ground, am I right Sir? I just could not get where this 0-0.15 range starts.
I think I will need to re-evaluate my areas then or worse, manually creating a polyline with each area range and hatching it.
Message 6 of 37
11-23-2012
04:26 AM
- Mark as New
- Bookmark
- Subscribe
- Mute
- Subscribe to RSS Feed
- Permalink
- Report
11-23-2012
04:26 AM
Extracting user defined contours (intervals 0.15, 0.30, 0.45, 0.6 etc) from the volume surface will show the areas
neilyj (No connection with Autodesk other than using the products in the real world)
Did you find this post helpful? Feel free to Like this post.
Did your question get successfully answered? Then click on the ACCEPT SOLUTION button.
AEC Collection 2025 UKIE (mainly Civil 3D UKIE and IW)
Win 11 Pro x64, 1Tb Primary SSD, 1Tb Secondary SSD
64Gb RAM Intel(R) Xeon(R) W-11855M CPU @ 3.2GHz
NVIDIA RTX A5000 16Gb, Dual 27" Monitor, Dell Inspiron 7760
Message 7 of 37
11-23-2012
06:40 AM
- Mark as New
- Bookmark
- Subscribe
- Mute
- Subscribe to RSS Feed
- Permalink
- Report
11-23-2012
06:40 AM
thanks for the tip Sir, I created the user defined contours but I could not show the area in the table. Or I am doing it incorrectly? Do i nead to extract it so it wil become a polyline and get manually da area?
Message 8 of 37
11-23-2012
07:17 AM
- Mark as New
- Bookmark
- Subscribe
- Mute
- Subscribe to RSS Feed
- Permalink
- Report
11-23-2012
07:17 AM
@Anonymous wrote:thanks for the tip Sir, I created the user defined contours but I could not show the area in the table. Or I am doing it incorrectly? Do i nead to extract it so it wil become a polyline and get manually da area?
Not sure what you mean by this - can you post dwg?? As said befor the areas obtained from the table CANNOT be used directly for any useful purpose (I have been on to AutoDesk about the uselessness of this table but they aren't doing anything to improve it)
neilyj (No connection with Autodesk other than using the products in the real world)
Did you find this post helpful? Feel free to Like this post.
Did your question get successfully answered? Then click on the ACCEPT SOLUTION button.
AEC Collection 2025 UKIE (mainly Civil 3D UKIE and IW)
Win 11 Pro x64, 1Tb Primary SSD, 1Tb Secondary SSD
64Gb RAM Intel(R) Xeon(R) W-11855M CPU @ 3.2GHz
NVIDIA RTX A5000 16Gb, Dual 27" Monitor, Dell Inspiron 7760
Message 9 of 37
11-23-2012
07:31 AM
- Mark as New
- Bookmark
- Subscribe
- Mute
- Subscribe to RSS Feed
- Permalink
- Report
11-23-2012
07:31 AM
Set the contour interval to 0.15m and use stage storage analysis?
Joe Bouza
Did you find this post helpful? Feel free to Like this post.
Did your question get successfully answered? Then click on the ACCEPT SOLUTION button.
Message 10 of 37
11-23-2012
07:55 AM
- Mark as New
- Bookmark
- Subscribe
- Mute
- Subscribe to RSS Feed
- Permalink
- Report
11-23-2012
07:55 AM
I wouldn't trust Stage Storage for this type of task as it is designed more for storage pond work i.e. a discrete and defined basin rather than potentially several smaller ill defined areas.
If you do try Stage Storage then be sure to save your drawing beforehand or use a copy
neilyj (No connection with Autodesk other than using the products in the real world)
Did you find this post helpful? Feel free to Like this post.
Did your question get successfully answered? Then click on the ACCEPT SOLUTION button.
AEC Collection 2025 UKIE (mainly Civil 3D UKIE and IW)
Win 11 Pro x64, 1Tb Primary SSD, 1Tb Secondary SSD
64Gb RAM Intel(R) Xeon(R) W-11855M CPU @ 3.2GHz
NVIDIA RTX A5000 16Gb, Dual 27" Monitor, Dell Inspiron 7760
Message 11 of 37
11-23-2012
09:14 AM
- Mark as New
- Bookmark
- Subscribe
- Mute
- Subscribe to RSS Feed
- Permalink
- Report
11-23-2012
09:14 AM
Are you trying to get it in 0.15 elevation increments or 0.15 depth of fill over the entire site? If the former, perhaps something like this: http://civil3dplus.wordpress.com/2012/01/26/filling-curve-using-volumes-dashboard/
Message 12 of 37
11-23-2012
11:53 AM
- Mark as New
- Bookmark
- Subscribe
- Mute
- Subscribe to RSS Feed
- Permalink
- Report
11-23-2012
11:53 AM
I don't know about tables, but I think this is the best option to get the right contours to display:

Mark Green
Working on Civil 3D in Canada![]()
Message 13 of 37
11-23-2012
12:01 PM
- Mark as New
- Bookmark
- Subscribe
- Mute
- Subscribe to RSS Feed
- Permalink
- Report
11-23-2012
12:01 PM
ohh.. OK good advice
Joe Bouza
Did you find this post helpful? Feel free to Like this post.
Did your question get successfully answered? Then click on the ACCEPT SOLUTION button.
Message 14 of 37
11-23-2012
08:21 PM
- Mark as New
- Bookmark
- Subscribe
- Mute
- Subscribe to RSS Feed
- Permalink
- Report
11-23-2012
08:21 PM
I have checked the dashboard solution Sir, but unfortunately I already have submitted the areas for fill using the elevation analysis. I can create a flat surface but I could not know the exact elevation in my first layer.
Please find attached herewith the sample drawing.
Kindly enlighten me more.
Message 15 of 37
11-24-2012
03:36 AM
- Mark as New
- Bookmark
- Subscribe
- Mute
- Subscribe to RSS Feed
- Permalink
- Report
11-24-2012
03:36 AM
Ive not got Civil3D on this computer but a thought of how to get the 0.15 0.3 0.45 etc contours to reflect actual ground level would be to extract the user contours and convert to feature lines taking the levels from the EGL and the raising the feature lines by the appropriate amount e.g. 0.15 0.3 0.45 etc.
There's probably a slicker way to do this but I haven't though too hard about it......may take a look when next in front of Civil 3D
neilyj (No connection with Autodesk other than using the products in the real world)
Did you find this post helpful? Feel free to Like this post.
Did your question get successfully answered? Then click on the ACCEPT SOLUTION button.
AEC Collection 2025 UKIE (mainly Civil 3D UKIE and IW)
Win 11 Pro x64, 1Tb Primary SSD, 1Tb Secondary SSD
64Gb RAM Intel(R) Xeon(R) W-11855M CPU @ 3.2GHz
NVIDIA RTX A5000 16Gb, Dual 27" Monitor, Dell Inspiron 7760
Message 17 of 37
11-24-2012
09:05 AM
- Mark as New
- Bookmark
- Subscribe
- Mute
- Subscribe to RSS Feed
- Permalink
- Report
11-24-2012
09:05 AM
I am trying to fill the area with 15cm increments Sir. I found your dashboard solution more accurate however I have already submitted the areas for fill with 15cm increments, they now gave a method statement and planning documents with respect to that areas.
If I will make a flat surface and try to raise it every 15cm starting from the lowest point, my 1st layer of 15cm accummulates different area than my previous areas using elevation analysis.
Thank you for any ideas you can provide Sir.
Message 18 of 37
11-26-2012
06:13 AM
- Mark as New
- Bookmark
- Subscribe
- Mute
- Subscribe to RSS Feed
- Permalink
- Report
11-26-2012
06:13 AM
You seem to be assuming that the 1.35 - 1.50 range area is the lowest portion of the site.
This is not necessarily the case. It could be the lowest portion of the existing ground, or it could simply be the highest portion of the proposed ground. From your sample section it looks like it's a combination of both.
Are the 15cm lifts of fill necessarily placed horizontally? If so, it looks like you could have identified your areas wrong. Cut/Fill contours represent an even amount of cut or fill, but do not represent a horizontal line in real life.
Mark Green
Working on Civil 3D in Canada![]()
Message 19 of 37
11-26-2012
06:54 AM
- Mark as New
- Bookmark
- Subscribe
- Mute
- Subscribe to RSS Feed
- Permalink
- Report
11-26-2012
06:54 AM
So whtaever I find in the Area for elevation banding is totally wrong? We need to place the fill horizontally 15cm thick to justify the specs for our client.
Any other method how could I do this Sir?
Message 20 of 37
11-26-2012
06:59 AM
- Mark as New
- Bookmark
- Subscribe
- Mute
- Subscribe to RSS Feed
- Permalink
- Report
11-26-2012
06:59 AM
See my post in message 12 of this discussion. That method will generate horizontal contours in 15cm intervals from whatever starting elevation you specify. In that case you only need to make sure you specify the right elevation to start from.
Mark Green
Working on Civil 3D in Canada![]()
Reply
Topic Options
- Subscribe to RSS Feed
- Mark Topic as New
- Mark Topic as Read
- Float this Topic for Current User
- Bookmark
- Subscribe
- Printer Friendly Page
Forums Links
Can't find what you're looking for? Ask the community or share your knowledge.
Post to forums

